Grouped bar chart
An estimate of the minimum drag coefficient of three aerofoil sections at four Reynolds numbers, in drag counts of one ten-thousandth. Each section's drag is twice the skin friction of a flat plate, laminar over the fraction of the chord ahead of transition and turbulent behind it, multiplied by a form factor that grows with the thickness of the section. The laminar-flow section NACA 63-415 keeps a longer run of laminar flow, so it has the least drag at every Reynolds number. The bars are grouped by Reynolds number: the bars helper writes each section as an ordinary bar series in the next colour of the colour order, a third of the cluster wide and offset by whole widths from the centre of its category, and each series has its own legend entry. The categories are the positions 0 to 3, named by text tick labels.
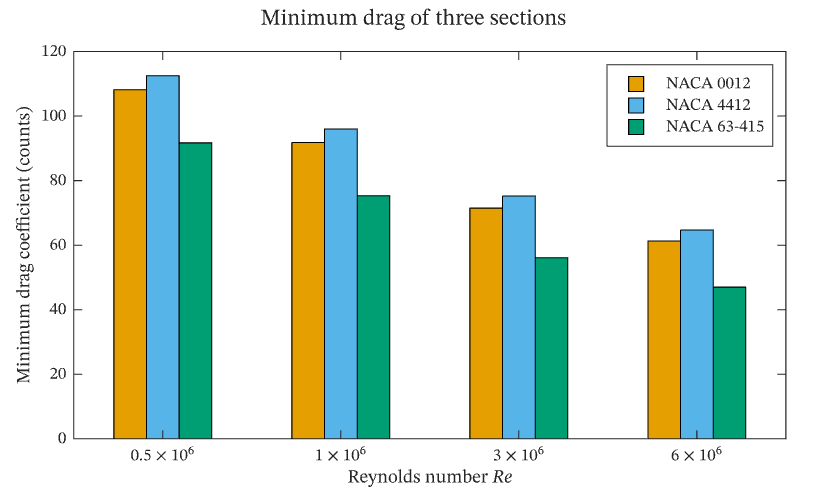
The figure above is live, drawn in the browser by the same engine that draws the viewer: drag it to pan, and click it to zoom with the wheel. Download the PDF for the vector figure that IronLAB exports, or read how to embed a figure of your own.
Source
The figure is built by the following code.
use ironlab::prelude::*;

pub const TITLE: &str = "Grouped bar chart";
pub const DESCRIPTION: &str = "An estimate of the minimum drag coefficient of three aerofoil sections at four \
     Reynolds numbers, in drag counts of one ten-thousandth. Each section's drag is twice the skin friction of a flat \
     plate, laminar over the fraction of the chord ahead of transition and turbulent behind it, multiplied by a form \
     factor that grows with the thickness of the section. The laminar-flow section NACA 63-415 keeps a longer run of \
     laminar flow, so it has the least drag at every Reynolds number. The bars are grouped by Reynolds number: the \
     `bars` helper writes each section as an ordinary bar series in the next colour of the colour order, a third of \
     the cluster wide and offset by whole widths from the centre of its category, and each series has its own legend \
     entry. The categories are the positions 0 to 3, named by text tick labels.";

/// The sections compared: a name, the thickness as a fraction of the chord, and the fraction of the chord over
/// which the boundary layer stays laminar.
const SECTIONS: [(&str, f64, f64); 3] = [
    ("NACA 0012", 0.12, 0.30),
    ("NACA 4412", 0.12, 0.25),
    ("NACA 63-415", 0.15, 0.55),
];

/// The Reynolds numbers, in millions, one per category.
const REYNOLDS_MILLIONS: [f64; 4] = [0.5, 1.0, 3.0, 6.0];

/// Returns the minimum drag coefficient, in drag counts, of a section of thickness `thickness` whose boundary layer
/// is laminar over the fraction `laminar` of the chord, at the Reynolds number `reynolds`.
///
/// The skin friction blends the Blasius laminar value 1.328/√Re and the turbulent power law 0.074/Re^0.2 by the
/// laminar fraction; both surfaces are wetted, and the form factor 1 + 2t + 60t⁴ accounts for the thickness.
fn drag_counts(thickness: f64, laminar: f64, reynolds: f64) -> f64 {
    let friction = laminar * 1.328 / reynolds.sqrt() + (1.0 - laminar) * 0.074 / reynolds.powf(0.2);
    let form = 1.0 + 2.0 * thickness + 60.0 * thickness.powi(4);
    2.0 * friction * form * 1.0e4
}

pub fn figure() -> Figure {
    let categories: Vec<f64> = (0..REYNOLDS_MILLIONS.len()).map(|k| k as f64).collect();

    let mut fig = Figure::new()
        .size_mm(140.0, 85.0)
        .title("Minimum drag of three sections")
        .tag("bar")
        .tag("legend")
        .tag("comparison")
        .tag("categorical")
        .tag("grouped")
        .tag("aerodynamics")
        .parameter("dimensionality", "2D")
        .parameter("artists", SECTIONS.len() as i64)
        .parameter("data_points", 16)
        .parameter("has_legend", true);
    let mut ax = fig.axes(0, 0);
    let mut bars = ax.bars(&categories);
    for (name, thickness, laminar) in SECTIONS {
        let counts: Vec<f64> = REYNOLDS_MILLIONS
            .iter()
            .map(|re| drag_counts(thickness, laminar, re * 1.0e6))
            .collect();
        bars.series(name, counts);
    }
    ax.xticks(&categories)
        .xtick_labels(REYNOLDS_MILLIONS.map(|re| format!(r"${re} \times 10^6$")))
        .xlabel("Reynolds number $Re$")
        .ylabel("Minimum drag coefficient (counts)")
        .legend(LegendLocation::NorthEast);
    fig
}