Stacked, horizontal, floating and highlighted bars
Four ways of drawing bars, each in its own axes. The stacked bars are the annual heat balance of four zones of a building: the gains stack upwards from zero and the losses downwards, each part an ordinary bar series whose bases are the running totals of the parts before it, so that the heating each zone needs is what closes its balance and the two stacks of a zone are equally long. A legend panel under the axes, in a row fitted to its entries, keys the five parts. The horizontal bars give the mean downtime per failure of six subsystems of a wind turbine, laid flat so that their long names read level, with the first subsystem at the top. The floating bars show the range over which six substances are liquid at atmospheric pressure: each bar starts at the melting point, its base, and is as long as the difference between the boiling and melting points, its value. The last axes compares the specific strength of six structural materials, the tensile strength divided by the density, with per-bar colours that draw every bar grey except carbon-fibre composite. The names under both lower axes are turned by 30° so that they do not collide.
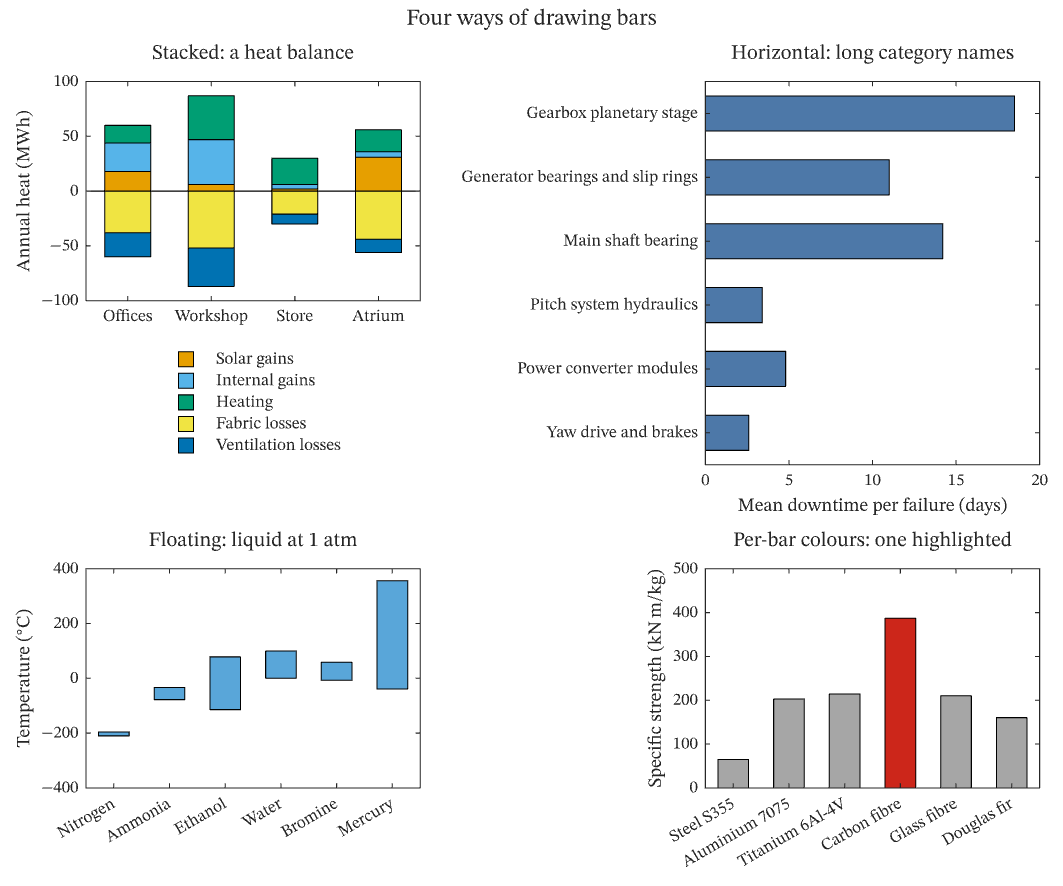
The figure above is live, drawn in the browser by the same engine that draws the viewer: drag it to pan, and click it to zoom with the wheel. Download the PDF for the vector figure that IronLAB exports, or read how to embed a figure of your own.
Source
The figure is built by the following code.
use ironlab::prelude::*;

pub const TITLE: &str = "Stacked, horizontal, floating and highlighted bars";
pub const DESCRIPTION: &str = "Four ways of drawing bars, each in its own axes. The stacked bars are the annual \
     heat balance of four zones of a building: the gains stack upwards from zero and the losses downwards, each part \
     an ordinary bar series whose bases are the running totals of the parts before it, so that the heating each zone \
     needs is what closes its balance and the two stacks of a zone are equally long. A legend panel under the axes, \
     in a row fitted to its entries, keys the five parts. The horizontal bars give the mean downtime per failure of \
     six subsystems of a wind turbine, laid flat so that their long names read level, with the first subsystem at \
     the top. The floating bars show the range over which six substances are liquid at atmospheric pressure: each \
     bar starts at the melting point, its base, and is as long as the difference between the boiling and melting \
     points, its value. The last axes compares the specific strength of six structural materials, the tensile \
     strength divided by the density, with per-bar colours that draw every bar grey except carbon-fibre composite. \
     The names under both lower axes are turned by 30° so that they do not collide.";

/// The zones of the building, with their annual solar and internal gains and their fabric and ventilation losses,
/// in megawatt hours. The heating closes the balance.
const ZONES: [(&str, f64, f64, f64, f64); 4] = [
    ("Offices", 18.0, 26.0, 38.0, 22.0),
    ("Workshop", 6.0, 41.0, 52.0, 35.0),
    ("Store", 2.0, 4.0, 21.0, 9.0),
    ("Atrium", 31.0, 5.0, 44.0, 12.0),
];

/// The subsystems of a wind turbine and their mean downtime per failure, in days.
const SUBSYSTEMS: [(&str, f64); 6] = [
    ("Gearbox planetary stage", 18.5),
    ("Generator bearings and slip rings", 11.0),
    ("Main shaft bearing", 14.2),
    ("Pitch system hydraulics", 3.4),
    ("Power converter modules", 4.8),
    ("Yaw drive and brakes", 2.6),
];

/// Substances with their melting and boiling points at atmospheric pressure, in degrees Celsius.
const LIQUID_RANGES: [(&str, f64, f64); 6] = [
    ("Nitrogen", -210.0, -195.8),
    ("Ammonia", -77.7, -33.3),
    ("Ethanol", -114.1, 78.4),
    ("Water", 0.0, 100.0),
    ("Bromine", -7.2, 58.8),
    ("Mercury", -38.8, 356.7),
];

/// Structural materials with their tensile strength in megapascals and their density in kilograms per cubic metre.
const MATERIALS: [(&str, f64, f64); 6] = [
    ("Steel S355", 510.0, 7850.0),
    ("Aluminium 7075", 570.0, 2810.0),
    ("Titanium 6Al-4V", 950.0, 4430.0),
    ("Carbon fibre", 600.0, 1550.0),
    ("Glass fibre", 400.0, 1900.0),
    ("Douglas fir", 85.0, 530.0),
];

/// The material that the last axes highlights.
const HIGHLIGHTED: &str = "Carbon fibre";

pub fn figure() -> Figure {
    let mut fig = Figure::new()
        .size_mm(180.0, 150.0)
        .tiles(3, 2)
        .fit_row(1)
        .title("Four ways of drawing bars")
        .tag("bar")
        .tag("line")
        .tag("subplots")
        .tag("legend")
        .tag("categorical")
        .tag("ticks")
        .tag("stacked")
        .tag("horizontal")
        .tag("floating")
        .tag("highlighted")
        .tag("tick-angle")
        .tag("engineering")
        .parameter("dimensionality", "2D")
        .parameter("artists", 9)
        .parameter("data_points", 96)
        .parameter("has_legend", true);

    // The heat balance: gains above zero, losses below, and the heating that closes the balance of each zone. Its key
    // is a legend panel under the axes, in a row fitted to its entries.
    let zones: Vec<f64> = (0..ZONES.len()).map(|k| k as f64).collect();
    let column = |pick: fn(&(&str, f64, f64, f64, f64)) -> f64| -> Vec<f64> { ZONES.iter().map(pick).collect() };
    let solar = column(|z| z.1);
    let internal = column(|z| z.2);
    let heating = column(|z| z.3 + z.4 - z.1 - z.2);
    let fabric = column(|z| -z.3);
    let ventilation = column(|z| -z.4);
    let key = fig.panel(1, 0).legend().boxed(false).id();
    let mut ax = fig.axes(0, 0);
    ax.bars(&zones)
        .stacked("balance", "Solar gains", solar)
        .stacked("balance", "Internal gains", internal)
        .stacked("balance", "Heating", heating)
        .stacked("balance", "Fabric losses", fabric)
        .stacked("balance", "Ventilation losses", ventilation);
    ax.hline(0.0).color(Color::BLACK).line_width(0.5);
    ax.xcategories(ZONES.map(|z| z.0))
        .ylabel("Annual heat (MWh)")
        .title("Stacked: a heat balance")
        .legend_in(key);

    // The downtime of each subsystem, laid flat so that the long names read level.
    let rows: Vec<f64> = (0..SUBSYSTEMS.len()).map(|k| k as f64).collect();
    let mut ax = fig.axes_span(0, 1, 2, 1);
    ax.barh(&rows, SUBSYSTEMS.map(|s| s.1))
        .face_color(Color::rgb(0.30, 0.47, 0.66));
    ax.ycategories(SUBSYSTEMS.map(|s| s.0))
        .xlabel("Mean downtime per failure (days)")
        .title("Horizontal: long category names");

    // The liquid range of each substance: a bar from its melting point, as long as the range.
    let substances: Vec<f64> = (0..LIQUID_RANGES.len()).map(|k| k as f64).collect();
    let melting = LIQUID_RANGES.map(|s| s.1);
    let range = LIQUID_RANGES.map(|s| s.2 - s.1);
    let mut ax = fig.axes(2, 0);
    ax.bar(&substances, range)
        .base_data(melting)
        .face_color(Color::rgb(0.35, 0.65, 0.85));
    ax.xcategories(LIQUID_RANGES.map(|s| s.0))
        .xtick_label_angle(30.0)
        .ylabel(r"Temperature ($^\circ$C)")
        .title("Floating: liquid at 1 atm");

    // The specific strength of each material, with every bar grey but the highlighted one.
    let materials: Vec<f64> = (0..MATERIALS.len()).map(|k| k as f64).collect();
    let strength = MATERIALS.map(|m| m.1 / m.2 * 1.0e3);
    let grey = Color::rgb(0.65, 0.65, 0.65);
    let red = Color::rgb(0.80, 0.15, 0.10);
    let colors = MATERIALS.map(|m| if m.0 == HIGHLIGHTED { red } else { grey });
    let mut ax = fig.axes(2, 1);
    ax.bar(&materials, strength).colors(colors);
    ax.xcategories(MATERIALS.map(|m| m.0))
        .xtick_label_angle(30.0)
        .ylabel(r"Specific strength (kN$\,$m/kg)")
        .title("Per-bar colours: one highlighted");
    fig
}