Branch coverage occupancy matrix
The branch coverage of a synthetic panel-method code, as a test campaign might report it: one row per subroutine, grouped under a bold header row for each source file, and one square cell per branch of the subroutine, coloured by its status. The rows are ragged, because each subroutine has as many cells as it has branches, from 2 to 40; occupancy pads the short rows with NaN, which the categorical scale draws as nothing, and hides the x axis, because the position of a branch within its row names nothing. ycategory_groups lays out the headers, the members and a blank row between the files, and CategoryRows::place puts the branches of each subroutine in its own row. The five statuses are the categories of a categorical colour scale, keyed by a legend panel under the plot in which the scale is listed as an item. The cells are drawn at equal aspect, so that they are square. In the viewer, a datatip names the subroutine, the branch and its status.
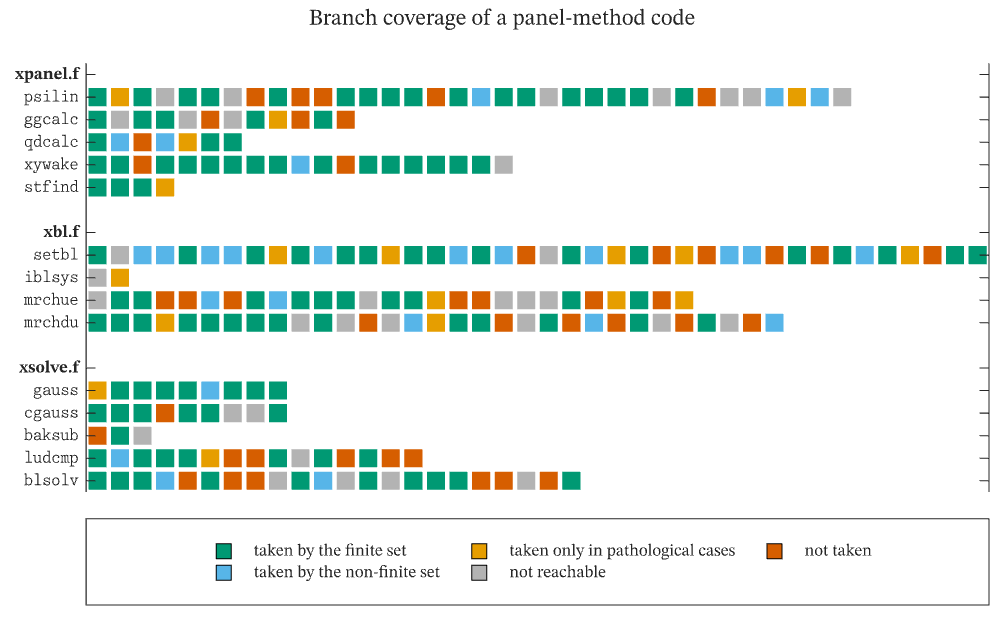
The figure above is live, drawn in the browser by the same engine that draws the viewer: drag it to pan, and click it to zoom with the wheel. Download the PDF for the vector figure that IronLAB exports, or read how to embed a figure of your own.
Source
The figure is built by the following code.
use ironlab::prelude::*;

pub const TITLE: &str = "Branch coverage occupancy matrix";
pub const DESCRIPTION: &str = "The branch coverage of a synthetic panel-method code, as a test campaign might \
     report it: one row per subroutine, grouped under a bold header row for each source file, and one square cell \
     per branch of the subroutine, coloured by its status. The rows are ragged, because each subroutine has as many \
     cells as it has branches, from 2 to 40; `occupancy` pads the short rows with NaN, which the categorical scale \
     draws as nothing, and hides the x axis, because the position of a branch within its row names nothing. \
     `ycategory_groups` lays out the headers, the members and a blank row between the files, and \
     `CategoryRows::place` puts the branches of each subroutine in its own row. The five statuses are the categories \
     of a categorical colour scale, keyed by a legend panel under the plot in which the scale is listed as an item. \
     The cells are drawn at equal aspect, so that they are square. In the viewer, a datatip names the subroutine, \
     the branch and its status.";

/// The source files, each with its subroutines and the number of branches of each.
const FILES: [(&str, &[(&str, usize)]); 3] = [
    (
        "xpanel.f",
        &[("psilin", 34), ("ggcalc", 12), ("qdcalc", 7), ("xywake", 19), ("stfind", 4)],
    ),
    ("xbl.f", &[("setbl", 40), ("iblsys", 2), ("mrchue", 27), ("mrchdu", 31)]),
    (
        "xsolve.f",
        &[("gauss", 9), ("cgauss", 9), ("baksub", 3), ("ludcmp", 15), ("blsolv", 22)],
    ),
];

/// The statuses of a branch, in the order of the categories of the scale.
const STATUSES: [(Color, &str); 5] = [
    (Color::rgb(0.00, 0.60, 0.45), "taken by the finite set"),
    (Color::rgb(0.34, 0.71, 0.91), "taken by the non-finite set"),
    (Color::rgb(0.90, 0.62, 0.00), "taken only in pathological cases"),
    (Color::rgb(0.70, 0.70, 0.70), "not reachable"),
    (Color::rgb(0.84, 0.37, 0.00), "not taken"),
];

/// A small deterministic generator, so that the statuses are the same on every run.
struct Lcg(u64);

impl Lcg {
    /// Returns a number drawn from `[0, 1)`.
    fn unit(&mut self) -> f64 {
        self.0 = self
            .0
            .wrapping_mul(6_364_136_223_846_793_005)
            .wrapping_add(1_442_695_040_888_963_407);
        (self.0 >> 11) as f64 / (1u64 << 53) as f64
    }
}

/// Returns the status of every branch of a subroutine with `branches` branches, as indices of [`STATUSES`].
///
/// Most branches are taken by the ordinary test set. Each subroutine has a share of its own of branches that only
/// the non-finite inputs reach, and the error branches towards the end of a subroutine are more often unreachable
/// or untaken.
fn statuses(branches: usize, rng: &mut Lcg) -> Vec<f64> {
    let guarded = 0.05 + 0.15 * rng.unit();
    (0..branches)
        .map(|b| {
            let late = b as f64 / branches as f64;
            let finite = 0.62 - 0.25 * late;
            let thresholds = [
                finite,
                finite + guarded,
                finite + guarded + 0.07,
                finite + guarded + 0.15 + 0.1 * late,
            ];
            let draw = rng.unit();
            thresholds.iter().take_while(|&&t| draw >= t).count() as f64
        })
        .collect()
}

pub fn figure() -> Figure {
    let mut rng = Lcg(74);
    let branches: Vec<Vec<f64>> = FILES
        .iter()
        .flat_map(|(_, members)| members.iter())
        .map(|&(_, n)| statuses(n, &mut rng))
        .collect();

    let mut fig = Figure::new()
        .size_mm(170.0, 105.0)
        .tiles(2, 1)
        .fit_row(1)
        .title("Branch coverage of a panel-method code")
        .tag("cells")
        .tag("color-scale")
        .tag("categorical")
        .tag("aspect")
        .tag("simulations")
        .tag("occupancy")
        .tag("grouped-rows")
        .tag("hidden-axis")
        .tag("coverage")
        .tag("testing")
        .parameter("dimensionality", "2D")
        .parameter("artists", 1)
        .parameter("data_points", 760)
        .parameter("has_legend", false);
    let status = fig.categorical_scale(STATUSES).id();

    let mut ax = fig.axes(0, 0);
    let rows = ax.ycategory_groups(FILES.iter().map(|(file, members)| {
        let names: Vec<String> = members
            .iter()
            .map(|(name, _)| format!(r"\texttt{{{name}}}"))
            .collect();
        (*file, names)
    }));
    ax.occupancy(rows.place(&branches)).color_scale(status);
    ax.aspect(Aspect::Equal);

    fig.panel(1, 0)
        .legend()
        .item(status)
        .columns(LegendEntryColumns::Count(3));
    fig
}