Branch map
Which equilibrium Newton's method finds for the imperfect pitchfork x³ − λx − ε = 0, started from x = 0.3, over a sweep of the load λ and the imperfection ε. Each cell is coloured by the branch the iteration converged to: the stable equilibrium with x > 0, the stable one with x < 0, the unstable one between them, or none within 40 iterations. The colours are a categorical colour scale. The sweep was run as batches of rows that stopped at different loads, and the cases that were never run are NaN: they are drawn as nothing and keyed by the scale's non-finite key, labelled "not run". Over the map are drawn the fold curve 4λ³ = 27ε², which bounds the region of three equilibria, its cusp at the origin, the line on which the starting point is itself a root, and the load at which each stopped batch ended. The key is one boxed legend panel under the plot in two columns, filled column by column: the scale listed as an item, which becomes one entry per category and its key, fills the first, and the four plotted features fill the second.
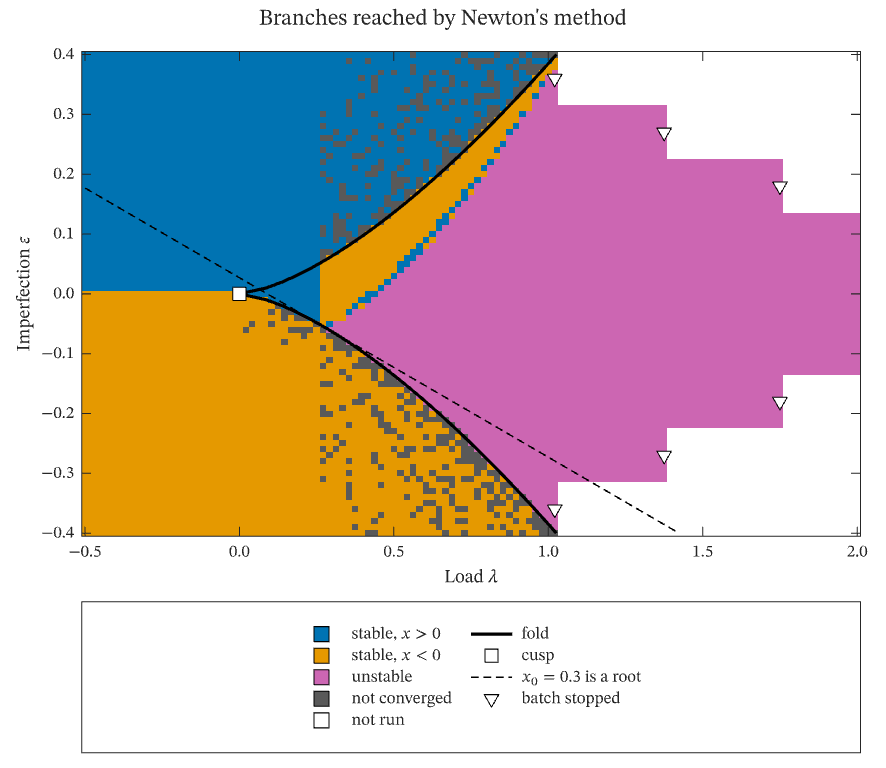
The figure above is live, drawn in the browser by the same engine that draws the viewer: drag it to pan, and click it to zoom with the wheel. Download the PDF for the vector figure that IronLAB exports, or read how to embed a figure of your own.
Source
The figure is built by the following code.
use ironlab::prelude::*;

pub const TITLE: &str = "Branch map";
pub const DESCRIPTION: &str = "Which equilibrium Newton's method finds for the imperfect pitchfork \
     x³ − λx − ε = 0, started from x = 0.3, over a sweep of the load λ and the imperfection ε. Each cell is coloured \
     by the branch the iteration converged to: the stable equilibrium with x > 0, the stable one with x < 0, the \
     unstable one between them, or none within 40 iterations. The colours are a categorical colour scale. The sweep \
     was run as batches of rows that stopped at different loads, and the cases that were never run are NaN: they are \
     drawn as nothing and keyed by the scale's non-finite key, labelled \"not run\". Over the map are drawn the fold \
     curve 4λ³ = 27ε², which bounds the region of three equilibria, its cusp at the origin, the line on which the \
     starting point is itself a root, and the load at which each stopped batch ended. The key is one boxed legend \
     panel under the plot in two columns, filled column by column: the scale listed as an item, which becomes one \
     entry per category and its key, fills the first, and the four plotted features fill the second.";

/// The number of loads swept, along the columns.
const LOADS: usize = 121;

/// The number of imperfections swept, along the rows.
const IMPERFECTIONS: usize = 81;

/// The number of rows that were run together as one batch, and so stopped at the same load.
const BATCH: usize = 9;

/// The initial guess of every solve.
const START: f64 = 0.3;

/// Returns the category of the equilibrium that Newton's method reaches from [`START`] for the load `lambda` and the
/// imperfection `epsilon`: 0 for a stable equilibrium with x > 0, 1 for a stable one with x < 0, 2 for an unstable
/// one, and 3 when the iteration does not converge.
fn branch(lambda: f64, epsilon: f64) -> f64 {
    let mut x = START;
    for _ in 0..40 {
        let f = x * x * x - lambda * x - epsilon;
        let slope = 3.0 * x * x - lambda;
        if slope.abs() < 1e-12 {
            return 3.0;
        }
        let step = f / slope;
        x -= step;
        if step.abs() < 1e-12 {
            // The second derivative of the potential x⁴/4 − λx²/2 − εx decides stability.
            return if 3.0 * x * x - lambda <= 0.0 {
                2.0
            } else if x > 0.0 {
                0.0
            } else {
                1.0
            };
        }
    }
    3.0
}

/// Returns the points of the fold curve 4λ³ = 27ε², on which two equilibria meet and vanish, over the imperfections
/// swept: λ = 3 (|ε| / 2)^(2/3), a cusp whose point is the origin.
fn fold(epsilon: &[f64]) -> (Vec<f64>, Vec<f64>) {
    let lambda = epsilon
        .iter()
        .map(|e| 3.0 * (e.abs() / 2.0).powf(2.0 / 3.0))
        .collect();
    (lambda, epsilon.to_vec())
}

/// Returns the number of loads that the batch of the given row ran before it stopped: every load for the batches
/// near ε = 0, and fewer for the batches further out, whose continuation was stopped earlier.
fn loads_run(row: usize) -> usize {
    let batch = row / BATCH;
    let centre = IMPERFECTIONS / BATCH / 2;
    let distance = batch.abs_diff(centre);
    let stopped = [0, 0, 12, 30, 47][distance.min(4)];
    LOADS - stopped
}

pub fn figure() -> Figure {
    let lambda = linspace(-0.5, 2.0, LOADS);
    let epsilon = linspace(-0.4, 0.4, IMPERFECTIONS);
    let cases = Matrix::from_fn(IMPERFECTIONS, LOADS, |row, col| {
        if col < loads_run(row) {
            branch(lambda[col], epsilon[row])
        } else {
            f64::NAN
        }
    });

    let (fold_lambda, fold_epsilon) = fold(&epsilon);
    // The last load that each stopped batch ran, at the imperfection of the batch's middle row.
    let (stop_lambda, stop_epsilon): (Vec<f64>, Vec<f64>) = (0..IMPERFECTIONS / BATCH)
        .map(|batch| batch * BATCH + BATCH / 2)
        .filter(|&row| loads_run(row) < LOADS)
        .map(|row| (lambda[loads_run(row) - 1], epsilon[row]))
        .unzip();
    // The starting point x₀ is itself a root where ε = x₀³ − λx₀, a line across the map from its left edge to its
    // bottom edge.
    let start_epsilon = [START.powi(3) - lambda[0] * START, epsilon[0]];
    let start_lambda = start_epsilon.map(|e| (START.powi(3) - e) / START);
    let overlays = 2 * fold_lambda.len() + 2 * stop_lambda.len() + 2 * 2 + 2;

    let mut fig = Figure::new()
        .size_mm(150.0, 130.0)
        .tiles(2, 1)
        .fit_row(1)
        .title("Branches reached by Newton's method")
        .tag("image")
        .tag("line")
        .tag("scatter")
        .tag("color-scale")
        .tag("categorical")
        .tag("legend")
        .tag("simulations")
        .parameter("dimensionality", "2D")
        .parameter("artists", 5)
        .parameter("data_points", (LOADS * IMPERFECTIONS + overlays) as i64)
        .parameter("has_legend", true);
    let cases = fig.data("branch", cases).id();
    let status = fig
        .categorical_scale([
            (Color::rgb(0.00, 0.45, 0.70), "stable, $x > 0$"),
            (Color::rgb(0.90, 0.60, 0.00), "stable, $x < 0$"),
            (Color::rgb(0.80, 0.40, 0.70), "unstable"),
            (Color::rgb(0.35, 0.35, 0.35), "not converged"),
        ])
        .key_label(ColorScaleKey::NonFinite, "not run")
        .id();

    let mut ax = fig.axes(0, 0);
    ax.scalar_image(cases)
        .pixel_columns(lambda[0], lambda[LOADS - 1])
        .pixel_rows(epsilon[0], epsilon[IMPERFECTIONS - 1])
        .color_scale(status);
    let ink = Color::BLACK;
    let fold = ax
        .plot(&fold_lambda, &fold_epsilon)
        .label("fold")
        .color(ink)
        .line_width(1.5)
        .id();
    let cusp = ax
        .scatter([0.0], [0.0])
        .label("cusp")
        .marker(Marker::Square)
        .marker_size(7.0)
        .marker_face(Color::WHITE)
        .marker_edge(ink)
        .id();
    let start = ax
        .plot(start_lambda, start_epsilon)
        .label("$x_0 = 0.3$ is a root")
        .color(ink)
        .dash(Dash::Dashed)
        .id();
    let stops = ax
        .scatter(&stop_lambda, &stop_epsilon)
        .label("batch stopped")
        .marker(Marker::TriangleDown)
        .marker_size(7.0)
        .marker_face(Color::WHITE)
        .marker_edge(ink)
        .id();
    ax.xlabel(r"Load $\lambda$").ylabel(r"Imperfection $\varepsilon$");

    // The key, in two columns filled column by column: the categorical scale listed as an item, which expands to one
    // entry per category and its key, five rows that fill the first column, and the four plotted features, which
    // fill the second. The axes sends its entries to the panel, whose explicit list orders them.
    let key = fig
        .panel(1, 0)
        .legend()
        .item(status)
        .item(fold)
        .item(cusp)
        .item(start)
        .item(stops)
        .columns(LegendEntryColumns::Count(2))
        .order(LegendEntryOrder::ColumnMajor)
        .id();
    fig.axes(0, 0).legend_in(key);
    fig
}