Case matrix
The number of iterations that a boundary-layer transition model took to converge in each case of a test matrix of Mach and Reynolds numbers, drawn through a discrete colour scale of five bands, so that each cell reads as a band of effort rather than an exact count. The scale is shown by a horizontal colourbar in a panel under the plot, whose non-finite key, labelled "not entered", keys the cases at low Reynolds number in which the flow stayed laminar and the model was never entered. Diamonds mark the cases compared with wind-tunnel measurements, and a legend inside the plot area lists them, over the corner of cases that the model never entered.
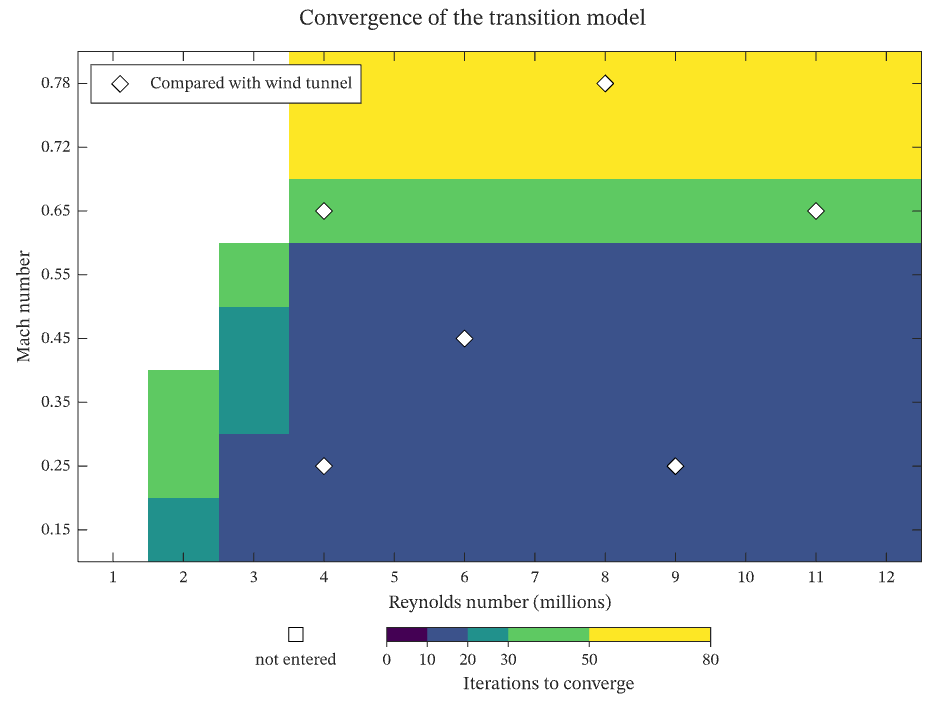
The figure above is live, drawn in the browser by the same engine that draws the viewer: drag it to pan, and click it to zoom with the wheel. Download the PDF for the vector figure that IronLAB exports, or read how to embed a figure of your own.
Source
The figure is built by the following code.
use ironlab::prelude::*;

pub const TITLE: &str = "Case matrix";
pub const DESCRIPTION: &str = "The number of iterations that a boundary-layer transition model took to converge \
     in each case of a test matrix of Mach and Reynolds numbers, drawn through a discrete colour scale of five bands, \
     so that each cell reads as a band of effort rather than an exact count. The scale is shown by a horizontal \
     colourbar in a panel under the plot, whose non-finite key, labelled \"not entered\", keys the cases at low \
     Reynolds number in which the flow stayed laminar and the model was never entered. Diamonds mark the cases \
     compared with wind-tunnel measurements, and a legend inside the plot area lists them, over the corner of cases \
     that the model never entered.";

/// The Mach numbers of the matrix, one per row.
const MACH: [f64; 8] = [0.15, 0.25, 0.35, 0.45, 0.55, 0.65, 0.72, 0.78];

/// The number of Reynolds numbers of the matrix, one per column, from 1 to 12 million.
const REYNOLDS: usize = 12;

/// The cases compared with the wind tunnel, as (row, column) of the matrix.
const COMPARED: [(usize, usize); 6] = [(1, 3), (1, 8), (3, 5), (5, 3), (5, 10), (7, 7)];

/// Returns the number of iterations of the transition model for a case, or NaN when the model was not entered.
///
/// The model is entered only when the Reynolds number exceeds a critical value that rises with Mach number, and it
/// takes longer near that value, where transition is marginal, and at high Mach number, where shocks move it.
fn iterations(mach: f64, reynolds_millions: f64) -> f64 {
    let critical = 1.5 + 4.0 * mach * mach;
    if reynolds_millions < critical {
        return f64::NAN;
    }
    let marginal = 40.0 / (1.0 + 2.0 * (reynolds_millions - critical));
    let compressible = 60.0 * (mach - 0.6).max(0.0) / 0.18;
    (4.0 + marginal + compressible + 2.0 * reynolds_millions.sqrt()).round()
}

pub fn figure() -> Figure {
    let reynolds = linspace(1.0, REYNOLDS as f64, REYNOLDS);
    let counts = Matrix::from_fn(MACH.len(), REYNOLDS, |row, col| {
        iterations(MACH[row], reynolds[col])
    });

    let mut fig = Figure::new()
        .size_mm(160.0, 120.0)
        .tiles(2, 1)
        .fit_row(1)
        .title("Convergence of the transition model")
        .tag("image")
        .tag("scatter")
        .tag("color-scale")
        .tag("colorbar")
        .tag("legend")
        .tag("simulations")
        .parameter("dimensionality", "2D")
        .parameter("artists", 2)
        .parameter("data_points", (MACH.len() * REYNOLDS + 2 * COMPARED.len()) as i64)
        .parameter("has_legend", true);
    let counts = fig.data("iterations", counts).id();
    let effort = fig
        .color_scale()
        .colormap(Colormap::Viridis)
        .discrete([0.0, 10.0, 20.0, 30.0, 50.0, 80.0])
        .key_label(ColorScaleKey::NonFinite, "not entered")
        .title("Iterations to converge")
        .id();
    let mut ax = fig.axes(0, 0);
    ax.scalar_image(counts)
        .pixel_columns(reynolds[0], reynolds[REYNOLDS - 1])
        .pixel_rows(0.0, (MACH.len() - 1) as f64)
        .color_scale(effort);
    let (x, y): (Vec<f64>, Vec<f64>) = COMPARED
        .iter()
        .map(|&(row, col)| (reynolds[col], row as f64))
        .unzip();
    ax.scatter(&x, &y)
        .label("Compared with wind tunnel")
        .marker(Marker::Diamond)
        .marker_size(7.0)
        .marker_face(Color::WHITE)
        .marker_edge(Color::BLACK);
    let rows: Vec<f64> = (0..MACH.len()).map(|k| k as f64).collect();
    let names: Vec<String> = MACH.iter().map(|m| format!("{m:.2}")).collect();
    ax.xlabel("Reynolds number (millions)")
        .ylabel("Mach number")
        .xticks(&reynolds)
        .yticks(&rows)
        .ytick_labels(names)
        .legend(LegendLocation::NorthWest);

    fig.panel(1, 0)
        .colorbar(effort)
        .orientation(ColorbarOrientation::Horizontal);
    fig
}