Coloured trajectory
The flight of a baseball struck at 40 m/s and 35° above the horizontal, in a vacuum and through still air, each line coloured along its length by the speed of the ball. In a vacuum the ball slows to 33 m/s at the top of its flight and lands as fast as it was struck; through air, drag slows it to 22 m/s near the top, it lands at 25 m/s, and its range is shorter by almost two fifths. The colour data holds one value per point, so each segment is drawn as a gradient between the speeds at its ends, and both trajectories share the default colour scale of the axes, which the horizontal colourbar in the fitted row beneath the axes shows.
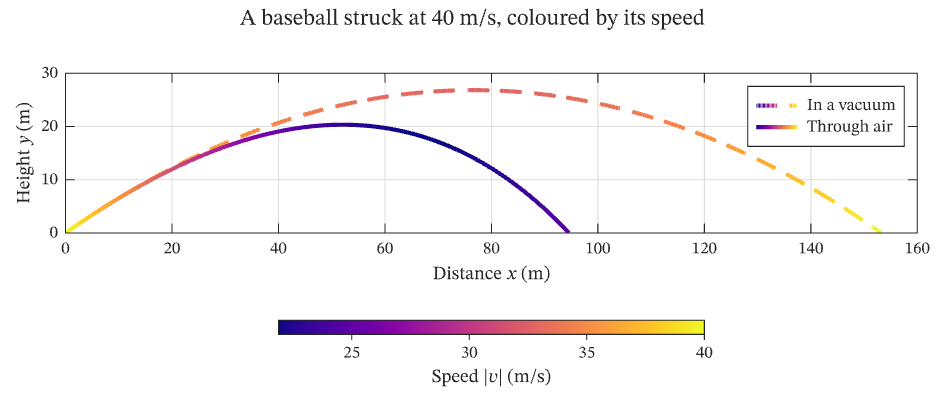
The figure above is live, drawn in the browser by the same engine that draws the viewer: drag it to pan, and click it to zoom with the wheel. Download the PDF for the vector figure that IronLAB exports, or read how to embed a figure of your own.
Source
The figure is built by the following code.
use ironlab::prelude::*;

pub const TITLE: &str = "Coloured trajectory";
pub const DESCRIPTION: &str = "The flight of a baseball struck at 40 m/s and 35° above the horizontal, in a vacuum \
     and through still air, each line coloured along its length by the speed of the ball. In a vacuum the ball slows \
     to 33 m/s at the top of its flight and lands as fast as it was struck; through air, drag slows it to 22 m/s \
     near the top, it lands at 25 m/s, and its range is shorter by almost two fifths. The colour data holds one \
     value per point, so each segment is drawn as a gradient between the speeds at its ends, and both trajectories \
     share the default colour scale of the axes, which the horizontal colourbar in the fitted row beneath the axes \
     shows.";

/// The acceleration due to gravity, in m/s².
const GRAVITY: f64 = 9.81;
/// The launch speed, in m/s.
const LAUNCH_SPEED: f64 = 40.0;
/// The launch angle above the horizontal, in degrees.
const LAUNCH_ANGLE_DEG: f64 = 35.0;
/// The drag constant `k` of a baseball in air, in 1/m, such that the deceleration due to drag is `k |v| v`:
/// `k = ρ C_d A / (2 m)` with air density ρ = 1.2 kg/m³, drag coefficient C_d = 0.35, a diameter of 74 mm and a
/// mass of 0.145 kg.
const DRAG: f64 = 1.2 * 0.35 * std::f64::consts::PI * 0.037 * 0.037 / (2.0 * 0.145);
/// The time step of the integration, in seconds.
const STEP: f64 = 0.02;

/// The position and velocity of the ball: x, y, vx and vy.
type State = [f64; 4];

/// Returns the time derivative of the state under gravity and quadratic drag of constant `drag`.
fn rate(state: State, drag: f64) -> State {
    let [_, _, vx, vy] = state;
    let speed = vx.hypot(vy);
    [vx, vy, -drag * speed * vx, -GRAVITY - drag * speed * vy]
}

/// Advances the state by one fourth-order Runge–Kutta step.
fn step(state: State, drag: f64) -> State {
    let along = |s: State, k: State, h: f64| -> State { std::array::from_fn(|i| s[i] + h * k[i]) };
    let k1 = rate(state, drag);
    let k2 = rate(along(state, k1, STEP / 2.0), drag);
    let k3 = rate(along(state, k2, STEP / 2.0), drag);
    let k4 = rate(along(state, k3, STEP), drag);
    std::array::from_fn(|i| state[i] + STEP / 6.0 * (k1[i] + 2.0 * k2[i] + 2.0 * k3[i] + k4[i]))
}

/// Integrates the flight from the launch until the ball returns to the ground, and returns the horizontal
/// distance, the height and the speed at each step. The last point is placed on the ground by linear
/// interpolation between the steps on either side of it.
fn flight(drag: f64) -> (Vec<f64>, Vec<f64>, Vec<f64>) {
    let angle = LAUNCH_ANGLE_DEG.to_radians();
    let mut state = [0.0, 0.0, LAUNCH_SPEED * angle.cos(), LAUNCH_SPEED * angle.sin()];
    let mut states = vec![state];
    loop {
        let next = step(state, drag);
        if next[1] < 0.0 {
            let f = state[1] / (state[1] - next[1]);
            states.push(std::array::from_fn(|i| state[i] + f * (next[i] - state[i])));
            break;
        }
        states.push(next);
        state = next;
    }
    let x = states.iter().map(|s| s[0]).collect();
    let y = states.iter().map(|s| s[1]).collect();
    let speed = states.iter().map(|s| s[2].hypot(s[3])).collect();
    (x, y, speed)
}

pub fn figure() -> Figure {
    let mut fig = Figure::new()
        .size_mm(160.0, 68.0)
        .tiles(2, 1)
        .fit_row(1)
        .title("A baseball struck at 40 m/s, coloured by its speed")
        .tag("line")
        .tag("legend")
        .tag("color-scale")
        .tag("dashes")
        .tag("comparison")
        .tag("aspect")
        .tag("physics")
        .tag("colorbar")
        .parameter("dimensionality", "2D")
        .parameter("artists", 2)
        .parameter("data_points", 1317)
        .parameter("has_legend", true);
    let mut ax = fig.axes(0, 0);
    let (x, y, speed) = flight(0.0);
    ax.plot(&x, &y)
        .color_data(&speed)
        .line_width(2.0)
        .dash(Dash::Dashed)
        .label("In a vacuum");
    let (x, y, speed) = flight(DRAG);
    ax.plot(&x, &y)
        .color_data(&speed)
        .line_width(2.0)
        .label("Through air");
    let speed = ax
        .color_scale()
        .colormap(Colormap::Plasma)
        .title("Speed $|v|$ (m/s)")
        .id();
    ax.xlabel("Distance $x$ (m)")
        .ylabel("Height $y$ (m)")
        .xlim(0.0, 160.0)
        .ylim(0.0, 30.0)
        .aspect(Aspect::Equal)
        .grid(true)
        .legend(LegendLocation::NorthEast);
    fig.panel(1, 0)
        .colorbar(speed)
        .orientation(ColorbarOrientation::Horizontal);
    fig
}