Comparison sheet
A synthetic polar sweep of an aerofoil computed by a reference code and by a candidate code, compared quantity by quantity over the angle of attack, which every panel shares. Dotted reference lines span the axes at a tolerance on a logarithmic axis and at the ends and middle of an interval; orange ticks along the top of each panel mark the angles at which the candidate's value is not a number. The ticks are placed at the data angle and at 98.5 % of the panel height, may overhang the top edge but are clipped to the angles in view, and take no part in the limits, so they stay on the edge while the reader pans and zooms. The legend of the lift panel explains the ticks once, with an item that stands for no plot. In the bottom right panel neither code converged at any angle, so the ticks are all there is.
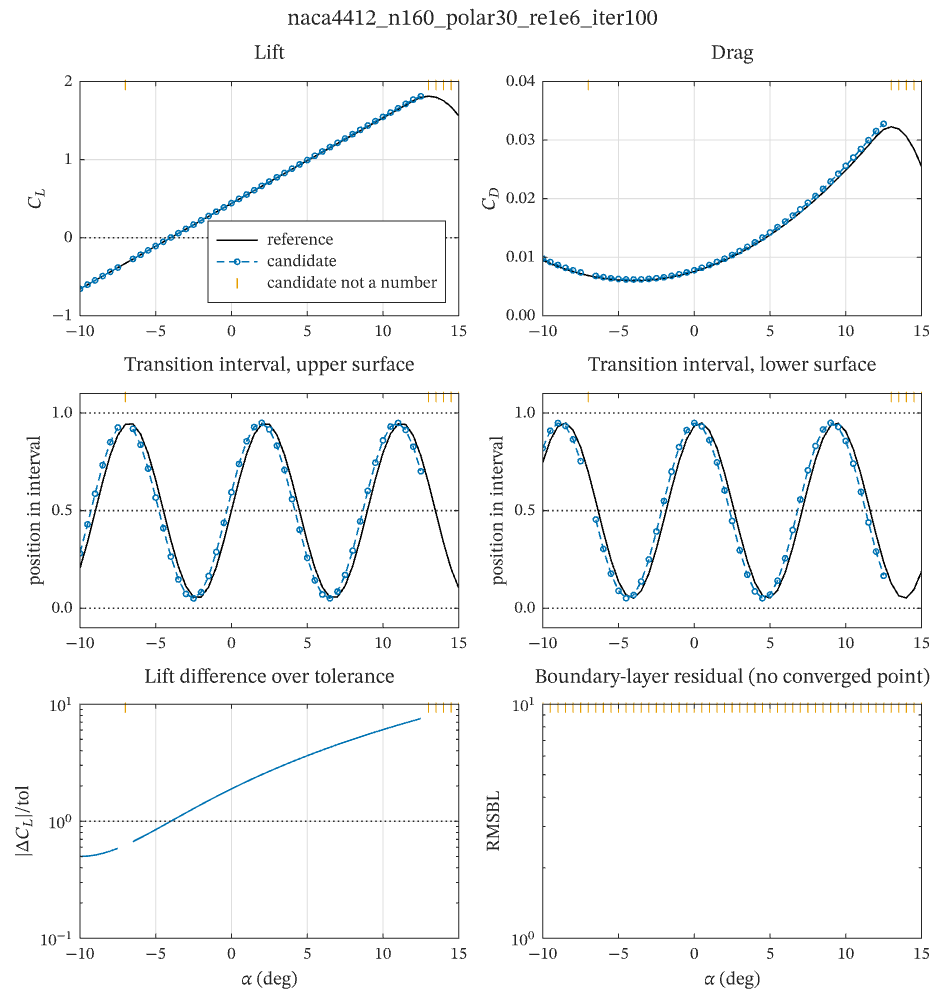
The figure above is live, drawn in the browser by the same engine that draws the viewer: drag it to pan, and click it to zoom with the wheel. Download the PDF for the vector figure that IronLAB exports, or read how to embed a figure of your own.
Source
The figure is built by the following code.
use ironlab::prelude::*;

pub const TITLE: &str = "Comparison sheet";
pub const DESCRIPTION: &str = "A synthetic polar sweep of an aerofoil computed by a reference code and by a \
     candidate code, compared quantity by quantity over the angle of attack, which every panel shares. Dotted \
     reference lines span the axes at a tolerance on a logarithmic axis and at the ends and middle of an interval; \
     orange ticks along the top of each panel mark the angles at which the candidate's value is not a number. The \
     ticks are placed at the data angle and at 98.5 % of the panel height, may overhang the top edge but are \
     clipped to the angles in view, and take no part in the limits, so they stay on the edge while the reader pans \
     and zooms. The legend of the lift panel explains the ticks once, with an item that stands for no plot. In the \
     bottom right panel neither code converged at any angle, so the ticks are all there is.";

/// The colour of the reference code's series.
const REFERENCE: Color = Color::rgb(0.0, 0.0, 0.0);
/// The colour of the candidate code's series.
const CANDIDATE: Color = Color::rgb(0.0, 0.45, 0.70);
/// The colour of the ticks that mark values that are not a number.
const NOT_FINITE: Color = Color::rgb(0.90, 0.62, 0.0);

/// The height of the ticks that mark values that are not a number, as a fraction of the panel height.
const TICK_HEIGHT: f64 = 0.985;

/// The angles of attack, in degrees, at which the candidate code did not converge.
fn diverged(alpha: f64) -> bool {
    alpha >= 13.0 || (alpha - -7.0).abs() < 0.25
}

/// Returns `value` where the candidate converged at `alpha`, and NaN where it did not.
fn candidate(alpha: f64, value: f64) -> f64 {
    if diverged(alpha) { f64::NAN } else { value }
}

/// Draws a tick along the top edge of the axes at every angle at which `values` is not a number.
fn mark_not_finite(ax: &mut AxesMut, alpha: &[f64], values: &[f64]) -> NodeId {
    let at: Vec<f64> = alpha
        .iter()
        .zip(values)
        .filter(|(_, value)| !value.is_finite())
        .map(|(alpha, _)| *alpha)
        .collect();
    let height = vec![TICK_HEIGHT; at.len()];
    ax.plot(&at, &height)
        .y_coords(Coords::AxesFraction)
        .clip(false)
        .dash(Dash::None)
        .marker(Marker::VLine)
        .marker_size(5.0)
        .marker_edge(NOT_FINITE)
        .color(NOT_FINITE)
        .id()
}

/// Plots the reference and candidate values of one quantity over the angle of attack, with the ticks of the
/// candidate's missing values, and returns the identifiers of the reference and the candidate.
fn compare(
    ax: &mut AxesMut,
    alpha: &[f64],
    reference: &[f64],
    candidate: &[f64],
) -> (NodeId, NodeId) {
    let ids = (
        ax.plot(alpha, reference)
            .color(REFERENCE)
            .label("reference")
            .id(),
        ax.plot(alpha, candidate)
            .color(CANDIDATE)
            .dash(Dash::Dashed)
            .marker(Marker::Circle)
            .marker_size(2.5)
            .label("candidate")
            .id(),
    );
    mark_not_finite(ax, alpha, candidate);
    ids
}

pub fn figure() -> Figure {
    let mut fig = Figure::new()
        .size_mm(160.0, 170.0)
        .tiles(3, 2)
        .title("naca4412_n160_polar30_re1e6_iter100")
        .tag("line")
        .tag("scatter")
        .tag("subplots")
        .tag("legend")
        .tag("log")
        .tag("comparison")
        .tag("dashes")
        .tag("markers")
        .tag("linked-axes")
        .tag("reference-lines")
        .tag("edge-markers")
        .parameter("dimensionality", "2D")
        .parameter("artists", 25)
        .parameter("data_points", 1316)
        .parameter("has_legend", true);

    let alpha = linspace(-10.0, 15.0, 51);
    let rad = |a: f64| a.to_radians();

    // Lift rises linearly with the angle of attack and stalls softly above 12 degrees; the candidate reads high by an
    // amount that grows with the angle, from half the tolerance of 0.002 to several times it.
    let lift = |a: f64| 2.0 * std::f64::consts::PI * rad(a + 4.0) * (1.0 - ((a - 12.0) / 6.0).max(0.0).powi(2));
    let cl_ref: Vec<f64> = alpha.iter().map(|&a| lift(a)).collect();
    let cl_new: Vec<f64> = alpha
        .iter()
        .map(|&a| candidate(a, lift(a) + 1e-3 * (1.0 + ((a + 10.0) / 6.0).powi(2))))
        .collect();
    let mut ax = fig.axes(0, 0);
    let (reference, new) = compare(&mut ax, &alpha, &cl_ref, &cl_new);
    ax.hline(0.0).dash(Dash::Dotted);
    // The ticks have no display name, because every panel draws them; one item that stands for no plot explains them.
    let tick = LegendSample::Line {
        line: ironlab::LineStyle {
            color: ColorSpec::Rgba { color: NOT_FINITE },
            dash: Dash::None,
            ..ironlab::LineStyle::default()
        },
        marker: ironlab::MarkerStyle {
            shape: Marker::VLine,
            size_pt: 5.0,
            ..ironlab::MarkerStyle::default()
        },
    };
    ax.title("Lift")
        .ylabel("$C_L$")
        .grid(true)
        .legend(LegendLocation::SouthEast)
        .legend_entries(LegendEntries::Explicit(vec![
            LegendItem::artist(reference),
            LegendItem::artist(new),
            LegendItem::custom(tick, "candidate not a number"),
        ]));

    // Drag grows with the square of the lift.
    let drag = |a: f64| 0.006 + 0.008 * lift(a).powi(2);
    let cd_ref: Vec<f64> = alpha.iter().map(|&a| drag(a)).collect();
    let cd_new: Vec<f64> = alpha
        .iter()
        .map(|&a| candidate(a, drag(a) * 1.03))
        .collect();
    let mut ax = fig.axes(0, 1);
    compare(&mut ax, &alpha, &cd_ref, &cd_new);
    ax.title("Drag").ylabel("$C_D$").grid(true);

    // The position of transition within its station interval, from 0 at the upstream station to 1 at the
    // downstream one: dotted lines mark the ends and the middle of the interval.
    let interval = |a: f64, phase: f64| 0.5 + 0.45 * (0.7 * a + phase).sin();
    for (col, (side, phase)) in [("upper", 0.0), ("lower", 1.3)].into_iter().enumerate() {
        let reference: Vec<f64> = alpha.iter().map(|&a| interval(a, phase)).collect();
        let new: Vec<f64> = alpha
            .iter()
            .map(|&a| candidate(a, interval(a + 0.3, phase)))
            .collect();
        let mut ax = fig.axes(1, col as u32);
        compare(&mut ax, &alpha, &reference, &new);
        for end in [0.0, 0.5, 1.0] {
            ax.hline(end).dash(Dash::Dotted);
        }
        // Fixed limits a little wider than the interval keep the lines at its ends clear of the axes box.
        ax.title(format!("Transition interval, {side} surface"))
            .ylabel("position in interval")
            .ylim(-0.1, 1.1);
    }

    // The difference in lift relative to the tolerance, on a logarithmic axis: above the dotted line at 1 the
    // candidate is out of tolerance.
    let relative: Vec<f64> = cl_ref
        .iter()
        .zip(&cl_new)
        .map(|(r, n)| (n - r).abs() / 2e-3)
        .collect();
    let mut ax = fig.axes(2, 0);
    ax.semilogy(&alpha, &relative).color(CANDIDATE);
    mark_not_finite(&mut ax, &alpha, &relative);
    ax.hline(1.0).dash(Dash::Dotted);
    ax.title("Lift difference over tolerance")
        .xlabel(r"$\alpha$ (deg)")
        .ylabel(r"$|\Delta C_L| / \mathrm{tol}$")
        .grid(true);

    // Neither code converged its boundary layer at any angle, so every value is NaN and only the ticks are drawn;
    // the logarithmic axis has no data to scale to and shows its default decade.
    let residual = vec![f64::NAN; alpha.len()];
    let mut ax = fig.axes(2, 1);
    ax.semilogy(&alpha, &residual).color(REFERENCE);
    ax.semilogy(&alpha, &residual).color(CANDIDATE).dash(Dash::Dashed);
    mark_not_finite(&mut ax, &alpha, &residual);
    ax.title("Boundary-layer residual (no converged point)")
        .xlabel(r"$\alpha$ (deg)")
        .ylabel("RMSBL");

    fig.link_all_x()
        .expect("every axes of the figure can be linked");
    fig
}