Contour
Isolines of the Julia field at twelve automatically chosen levels, each coloured from the colormap by its level.
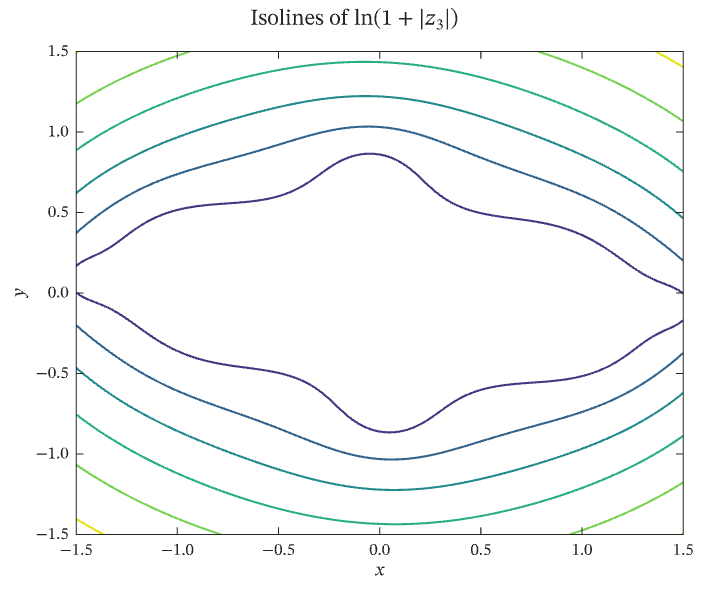
Select the image, or download the PDF, to open the vector figure exported by IronLAB.
Source
The figure is built by the following code. Its data comes from the functions on the data helpers page.
use ironlab::prelude::*;

use crate::fields::*;

pub const TITLE: &str = "Contour";
pub const DESCRIPTION: &str = "Isolines of the Julia field at twelve automatically chosen levels, each coloured from \
     the colormap by its level.";

pub fn figure() -> Figure {
    let (x, y, z) = julia_grid(121);

    let mut fig = Figure::new()
        .size_mm(120.0, 100.0)
        .title(r"Isolines of $\ln(1 + |z_3|)$");
    let mut ax = fig.axes(0, 0);
    ax.contour(&x, &y, &z).levels(12).line_width(1.0);
    ax.xlabel("$x$").ylabel("$y$");
    fig
}