Correlation peak in 3D
A three-dimensional cross-correlation volume, of the kind that locates a displacement in particle image velocimetry, drawn as colour-mapped images: one over the whole floor, and three quarter-size planes through the dominant peak at the centre, one in each coordinate plane at an explicit offset. Weaker noise peaks lie throughout the volume, several of them near the floor. An image lies in a plane of its axes at any offset, not only on the faces of the box. The three planes cross at the peak, and every backend draws each of them in front of the others exactly where it is nearer.
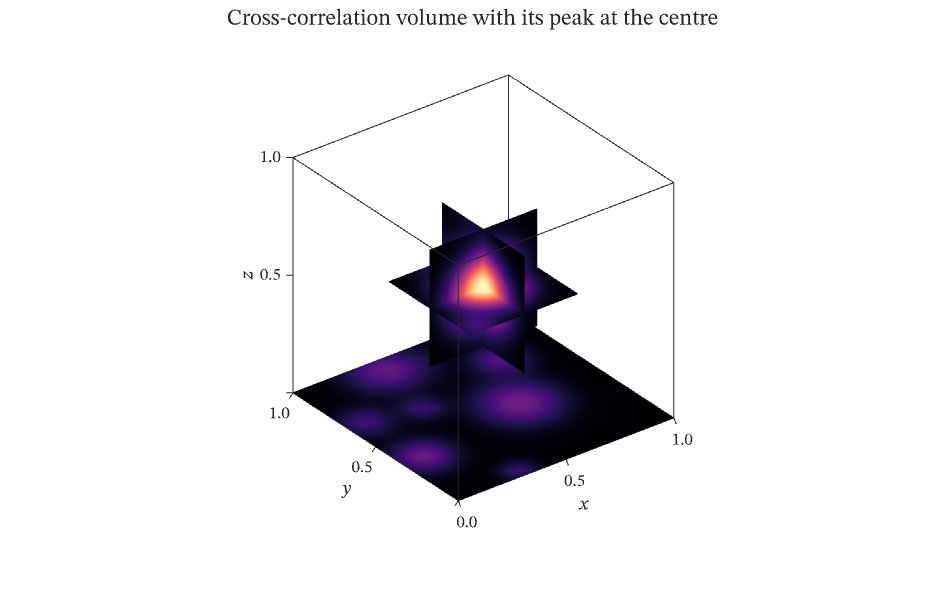
The figure above is live, drawn in the browser by the same engine that draws the viewer: drag it to pan, and click it to zoom with the wheel. Download the PDF for the vector figure that IronLAB exports, or read how to embed a figure of your own.
Source
The figure is built by the following code. Its data comes from the functions on the data helpers page.
use ironlab::prelude::*;

use crate::fields::*;

pub const TITLE: &str = "Correlation peak in 3D";
pub const DESCRIPTION: &str = "A three-dimensional cross-correlation volume, of the kind that locates a displacement \
     in particle image velocimetry, drawn as colour-mapped images: one over the whole floor, and three quarter-size \
     planes through the dominant peak at the centre, one in each coordinate plane at an explicit offset. Weaker \
     noise peaks lie throughout the volume, several of them near the floor. An image lies in a plane of its axes at \
     any offset, not only on the faces of the box. The three planes cross at the peak, and every backend draws each \
     of them in front of the others exactly where it is nearer.";

/// The number of pixels along each axis of every image.
const N: usize = 101;

/// Draws the correlation field on one plane of the axes as a scalar image of `N` by `N` pixels whose edges
/// span exactly `lo` to `hi` along both axes of the plane, sampling the field at the centre of every pixel with
/// `at`, which takes the coordinates along the first and second axes of the plane.
///
/// An image extends half a pitch beyond the centres of its first and last pixels, so for `N` pixels over `lo` to `hi`
/// the pitch is `(hi − lo) / N` and the centres run from half a pitch above `lo` to half a pitch below `hi`.
fn section(ax: &mut AxesMut<'_>, plane: ImagePlane, lo: f64, hi: f64, at: impl Fn(f64, f64) -> f64) {
    let pitch = (hi - lo) / N as f64;
    let centres = linspace(lo + pitch / 2.0, hi - pitch / 2.0, N);
    let values = Matrix::from_fn(N, N, |row, col| at(centres[col], centres[row]));
    ax.scalar_image(&values)
        .plane(plane)
        .pixel_columns(centres[0], centres[N - 1])
        .pixel_rows(centres[0], centres[N - 1]);
}

pub fn figure() -> Figure {
    let mut fig = Figure::new()
        .size_mm(160.0, 100.0)
        .title("Cross-correlation volume with its peak at the centre")
        .tag("image")
        .tag("depth")
        .tag("placement")
        .parameter("dimensionality", "3D")
        .parameter("artists", 4)
        .parameter("data_points", 40_804)
        .parameter("has_legend", false);
    let mut ax = fig.axes3(0, 0);
    // The floor lies on a face of the box, so it is painted behind everything else. The three planes through the
    // dominant peak cross there, and each carries the plane of its depth, so the depth buffer shows each of them in
    // front of the others where it is nearer; a PDF embeds the axes as an image for the same reason.
    section(&mut ax, ImagePlane::Xy { z: Some(0.0) }, 0.0, 1.0, |x, y| correlation_field(x, y, 0.0));
    section(&mut ax, ImagePlane::Xy { z: Some(0.5) }, 0.25, 0.75, |x, y| correlation_field(x, y, 0.5));
    section(&mut ax, ImagePlane::Xz { y: Some(0.5) }, 0.25, 0.75, |x, z| correlation_field(x, 0.5, z));
    section(&mut ax, ImagePlane::Yz { x: Some(0.5) }, 0.25, 0.75, |y, z| correlation_field(0.5, y, z));
    ax.color_scale().colormap(Colormap::Magma);
    ax.xlim(0.0, 1.0)
        .ylim(0.0, 1.0)
        .zlim(0.0, 1.0)
        .xlabel("$x$")
        .ylabel("$y$")
        .zlabel("$z$");
    fig
}