Flow past a cylinder
The speed of the potential flow past a circular cylinder, drawn as a surface in a two-dimensional axes on a polar mesh whose rings crowd towards the cylinder. A surface in a two-dimensional axes is seen from directly above, which makes it the pseudocolour plot of MATLAB's pcolor: the field values belong to the vertices of the mesh, so the mesh may be curvilinear, which the pixels of an image cannot be.
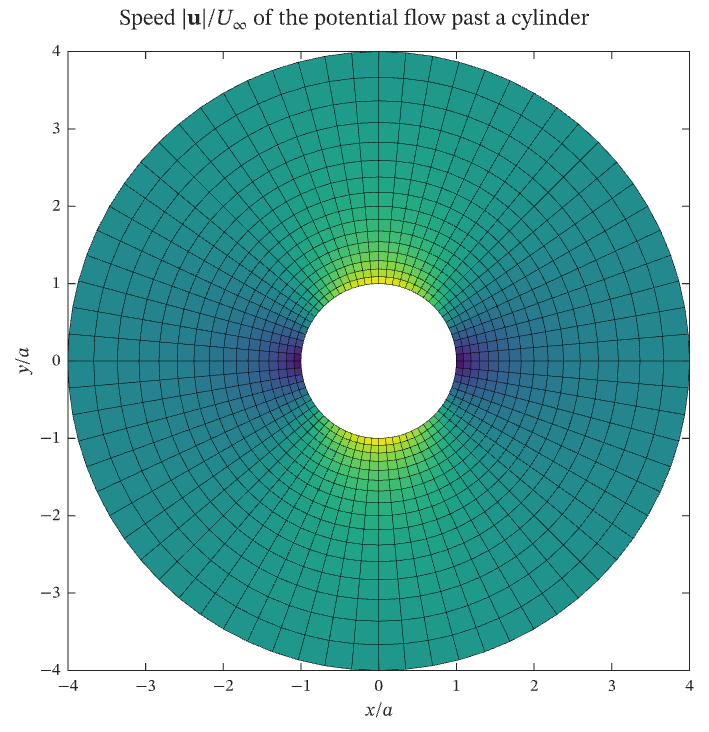
Select the image, or download the PDF, to open the vector figure exported by IronLAB.
Source
The figure is built by the following code. Its data comes from the functions on the data helpers page.
use ironlab::prelude::*;

use crate::fields::*;

pub const TITLE: &str = "Flow past a cylinder";
pub const DESCRIPTION: &str = "The speed of the potential flow past a circular cylinder, drawn as a surface in a \
     two-dimensional axes on a polar mesh whose rings crowd towards the cylinder. A surface in a two-dimensional axes \
     is seen from directly above, which makes it the pseudocolour plot of MATLAB's `pcolor`: the field values belong \
     to the vertices of the mesh, so the mesh may be curvilinear, which the pixels of an image cannot be.";

/// The number of rings of the mesh, from the surface of the cylinder to the outer radius.
const RINGS: usize = 17;

/// The number of spokes of the mesh; the first and the last coincide, which closes the mesh round the cylinder.
const SPOKES: usize = 73;

/// The radius of the outermost ring, in cylinder radii.
const OUTER_RADIUS: f64 = 4.0;

pub fn figure() -> Figure {
    // Matrices of coordinates, rather than vectors, give every vertex its own position.
    let (x, y, speed) = cylinder_flow_mesh(RINGS, SPOKES, OUTER_RADIUS);

    let mut fig = Figure::new()
        .size_mm(120.0, 124.0)
        .title(r"Speed $|\mathbf{u}| / U_\infty$ of the potential flow past a cylinder");
    let mut ax = fig.axes(0, 0);
    // `surface` leaves the axes two-dimensional, where `surf` would convert it to three dimensions.
    ax.surface(x, y, &speed).edge_width(0.25);
    ax.colormap(Colormap::Viridis)
        .xlabel("$x / a$")
        .ylabel("$y / a$");
    fig
}