Indexed image
The Julia field quantised into eight classes and drawn twice as an indexed image: a scalar image through an indexed colour scale of the 256 colours of viridis, whose pixels name entries of the palette directly. On the left the classes are stored as bytes; on the right they are floating-point indices with a frame of pixels at index 300, beyond the last entry, which the scale's policy for values outside its entries draws in a fixed colour.
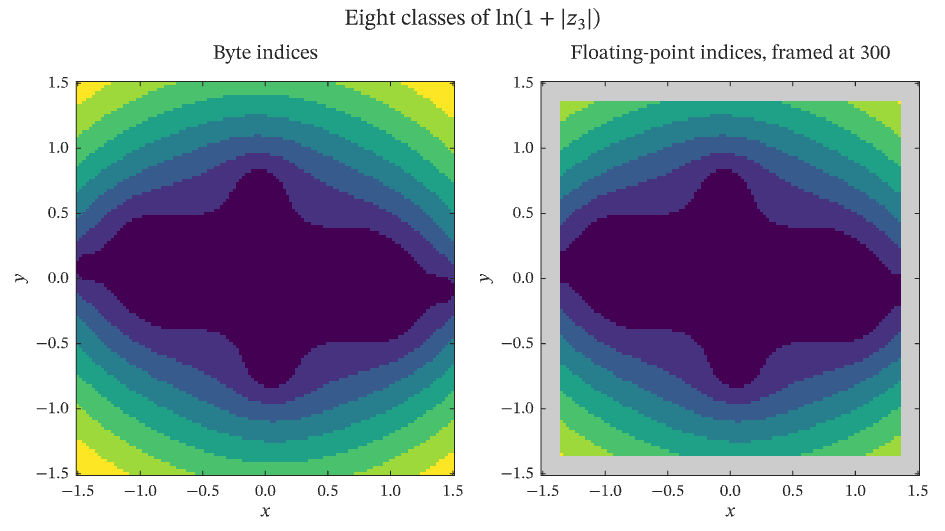
The figure above is live, drawn in the browser by the same engine that draws the viewer: drag it to pan, and click it to zoom with the wheel. Download the PDF for the vector figure that IronLAB exports, or read how to embed a figure of your own.
Source
The figure is built by the following code. Its data comes from the functions on the data helpers page.
use ironlab::prelude::*;

use crate::fields::*;

pub const TITLE: &str = "Indexed image";
pub const DESCRIPTION: &str = "The Julia field quantised into eight classes and drawn twice as an indexed image: a \
     scalar image through an indexed colour scale of the 256 colours of viridis, whose pixels name entries of the \
     palette directly. On the left the classes are stored as bytes; on the right they are floating-point indices \
     with a frame of pixels at index 300, beyond the last entry, which the scale's policy for values outside its \
     entries draws in a fixed colour.";

/// The number of classes into which the field is quantised.
const CLASSES: usize = 8;

/// The width, in pixels, of the frame of out-of-range indices around the second image.
const FRAME: usize = 6;

/// An index beyond the last entry of the palette.
const BEYOND_THE_PALETTE: f64 = 300.0;

pub fn figure() -> Figure {
    let (_, _, z) = julia_grid(121);
    let classes = quantise(&z, CLASSES);
    let (rows, cols) = (classes.rows(), classes.cols());
    let framed = Matrix::from_fn(rows, cols, |row, col| {
        let in_frame = row < FRAME || row >= rows - FRAME || col < FRAME || col >= cols - FRAME;
        if in_frame {
            BEYOND_THE_PALETTE
        } else {
            f64::from(classes[(row, col)])
        }
    });

    let mut fig = Figure::new()
        .size_mm(160.0, 90.0)
        .tiles(1, 2)
        .title(r"Eight classes of $\ln(1 + |z_3|)$")
        .tag("image")
        .tag("subplots")
        .tag("comparison")
        .tag("out-of-range")
        .parameter("dimensionality", "2D")
        .parameter("artists", 2)
        .parameter("data_points", 29_282)
        .parameter("has_legend", false);
    // Both images name one palette. Every index of the frame is a whole number, so it names no entry only because it
    // lies beyond the last, and the scale draws such a value in grey rather than refusing it.
    let palette = fig
        .indexed_scale(Colormap::Viridis.sample(256))
        .outside(Color::rgb(0.8, 0.8, 0.8))
        .id();
    let mut ax = fig.axes(0, 0);
    ax.scalar_image(&classes)
        .pixel_columns(DOMAIN_MIN, DOMAIN_MAX)
        .pixel_rows(DOMAIN_MIN, DOMAIN_MAX)
        .color_scale(palette);
    ax.title("Byte indices").xlabel("$x$").ylabel("$y$");

    let mut ax = fig.axes(0, 1);
    ax.scalar_image(&framed)
        .pixel_columns(DOMAIN_MIN, DOMAIN_MAX)
        .pixel_rows(DOMAIN_MIN, DOMAIN_MAX)
        .color_scale(palette);
    ax.title("Floating-point indices, framed at 300")
        .xlabel("$x$")
        .ylabel("$y$");
    fig
}