Inside colourbar
The elevation of the sea floor around a synthetic volcanic island, which rises from a continental slope falling from 200 m to 4000 m below sea level. The depths are drawn through the cividis colour scale from −4000 to 0 m, shown by a colourbar inside the plot area along its east edge, where the open ocean leaves room for it; the bar stands on a white box so that its ticks read over the field. Land lies above the range of the scale, so it is drawn in one brown, and the bar's key names it. The black line is the coastline.
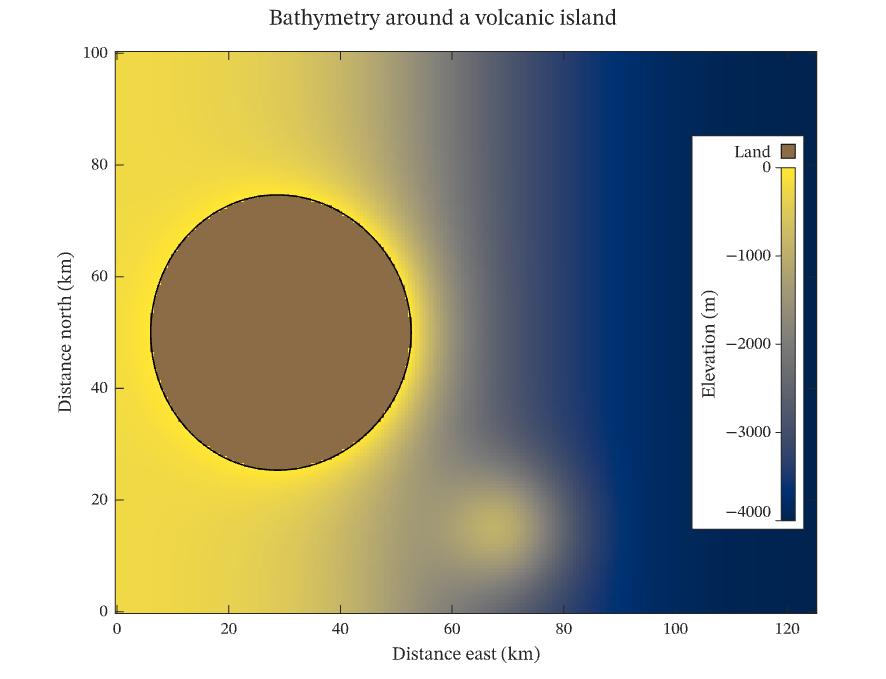
The figure above is live, drawn in the browser by the same engine that draws the viewer: drag it to pan, and click it to zoom with the wheel. Download the PDF for the vector figure that IronLAB exports, or read how to embed a figure of your own.
Source
The figure is built by the following code.
use ironlab::prelude::*;

pub const TITLE: &str = "Inside colourbar";
pub const DESCRIPTION: &str = "The elevation of the sea floor around a synthetic volcanic island, which rises from a \
     continental slope falling from 200 m to 4000 m below sea level. The depths are drawn through the cividis colour \
     scale from −4000 to 0 m, shown by a colourbar inside the plot area along its east edge, where the open ocean \
     leaves room for it; the bar stands on a white box so that its ticks read over the field. Land lies above the \
     range of the scale, so it is drawn in one brown, and the bar's key names it. The black line is the coastline.";

/// The number of samples east to west.
const COLUMNS: usize = 201;

/// The number of samples south to north.
const ROWS: usize = 161;

/// Returns the elevation, in metres, at a point `x` kilometres east and `y` kilometres north of the origin.
///
/// The continental slope is a hyperbolic tangent centred 60 km east of the origin, and the island is a Gaussian
/// cone 4600 m high and about 12 km in radius standing on it at (35, 50) km, with a smaller seamount to the south.
fn elevation(x: f64, y: f64) -> f64 {
    let slope = -2100.0 - 1900.0 * ((x - 60.0) / 25.0).tanh();
    let island = 4600.0 * (-((x - 35.0).powi(2) + (y - 50.0).powi(2)) / (2.0 * 12.0_f64.powi(2))).exp();
    let seamount = 1800.0 * (-((x - 70.0).powi(2) + (y - 15.0).powi(2)) / (2.0 * 8.0_f64.powi(2))).exp();
    slope + island + seamount
}

pub fn figure() -> Figure {
    let x = linspace(0.0, 125.0, COLUMNS);
    let y = linspace(0.0, 100.0, ROWS);
    let z = Matrix::from_fn(ROWS, COLUMNS, |row, col| elevation(x[col], y[row]));

    let mut fig = Figure::new()
        .size_mm(150.0, 115.0)
        .title("Bathymetry around a volcanic island")
        .tag("image")
        .tag("contour")
        .tag("color-scale")
        .tag("colorbar")
        .tag("out-of-range")
        .tag("aspect")
        .tag("map")
        .parameter("dimensionality", "2D")
        .parameter("artists", 2)
        .parameter("data_points", 32_723)
        .parameter("has_legend", false);
    let z = fig.data("elevation (m)", z).id();
    let depth = fig
        .color_scale()
        .colormap(Colormap::Cividis)
        .limits(-4000.0, 0.0)
        .above(Color::rgb(0.55, 0.42, 0.28))
        .key_label(ColorScaleKey::Above, "Land")
        .tick_step(1000.0)
        .title("Elevation (m)")
        .id();

    let mut ax = fig.axes(0, 0);
    ax.scalar_image(z)
        .pixel_columns(x[0], x[COLUMNS - 1])
        .pixel_rows(y[0], y[ROWS - 1])
        .color_scale(depth);
    ax.contour(&x, &y, z)
        .level_values([0.0])
        .color(Color::BLACK)
        .line_width(0.75);
    ax.colorbar(depth, InsideColorbarSide::East).length(0.7);
    ax.xlabel("Distance east (km)")
        .ylabel("Distance north (km)")
        .aspect(Aspect::Equal);
    fig
}