LaTeX labels
The frequency response of a driven, damped oscillator, whose title, axis labels and legend use LaTeX fractions, square roots, Greek letters, subscripts and units.
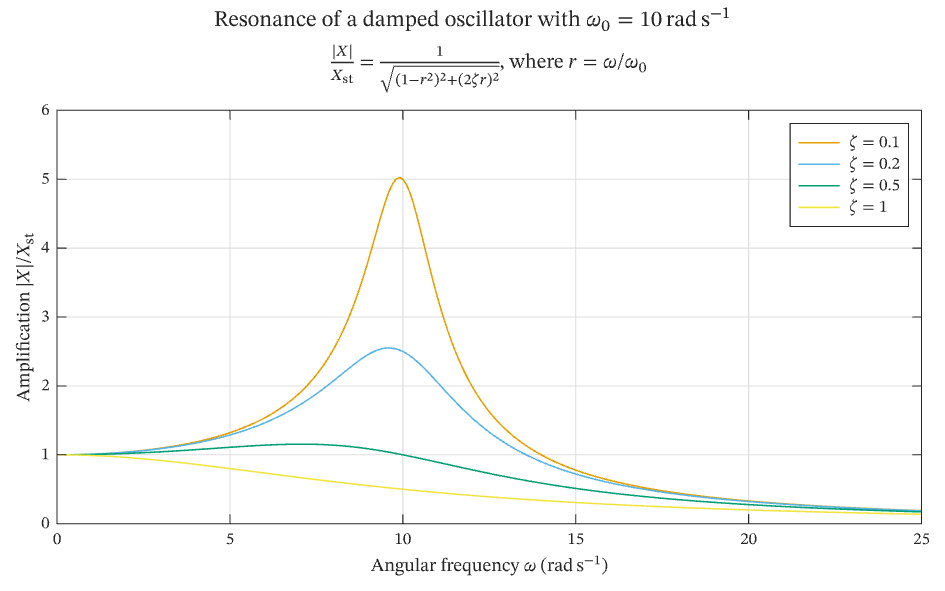
The figure above is live, drawn in the browser by the same engine that draws the viewer: drag it to pan, and click it to zoom with the wheel. Download the PDF for the vector figure that IronLAB exports, or read how to embed a figure of your own.
Source
The figure is built by the following code.
use ironlab::prelude::*;
pub const TITLE: &str = "LaTeX labels";
pub const DESCRIPTION: &str = "The frequency response of a driven, damped oscillator, whose title, axis labels and \
legend use LaTeX fractions, square roots, Greek letters, subscripts and units.";
pub fn figure() -> Figure {
let natural_frequency = 10.0; // ω₀ in rad/s
let omega = linspace(0.0, 25.0, 251);
let mut fig = Figure::new()
.size_mm(160.0, 100.0)
.title(r"Resonance of a damped oscillator with $\omega_0 = 10\,\mathrm{rad\,s^{-1}}$")
.label("line")
.label("legend")
.label("latex")
.label("signals")
.parameter("dimensionality", "2D")
.parameter("artists", 4)
.parameter("data_points", 2008)
.parameter("has_legend", true);
let mut ax = fig.axes(0, 0);
// One curve per damping ratio ζ: the lighter the damping, the higher and sharper the resonance peak at ω = ω₀.
for zeta in [0.1, 0.2, 0.5, 1.0] {
let amplification: Vec<f64> = omega
.iter()
.map(|w| {
let r = w / natural_frequency; // the frequency ratio ω / ω₀
1.0 / ((1.0 - r * r).powi(2) + (2.0 * zeta * r).powi(2)).sqrt()
})
.collect();
ax.plot(&omega, &lification)
.display_name(format!(r"$\zeta = {zeta}$"));
}
ax.title(r"$\frac{|X|}{X_\mathrm{st}} = \frac{1}{\sqrt{(1 - r^2)^2 + (2 \zeta r)^2}}$, where $r = \omega / \omega_0$")
.xlabel(r"Angular frequency $\omega$ ($\mathrm{rad\,s^{-1}}$)")
.ylabel(r"Amplification $|X| / X_\mathrm{st}$")
.ylim(0.0, 6.0)
.grid(true)
.legend(LegendLocation::NorthEast);
fig
}