Legend toggling
Four partial sums of the Fourier series of a square wave, named with LaTeX in the legend. In the viewer, click a legend entry to hide or show its series; a hidden series is greyed in the legend and is left out of an exported PDF.
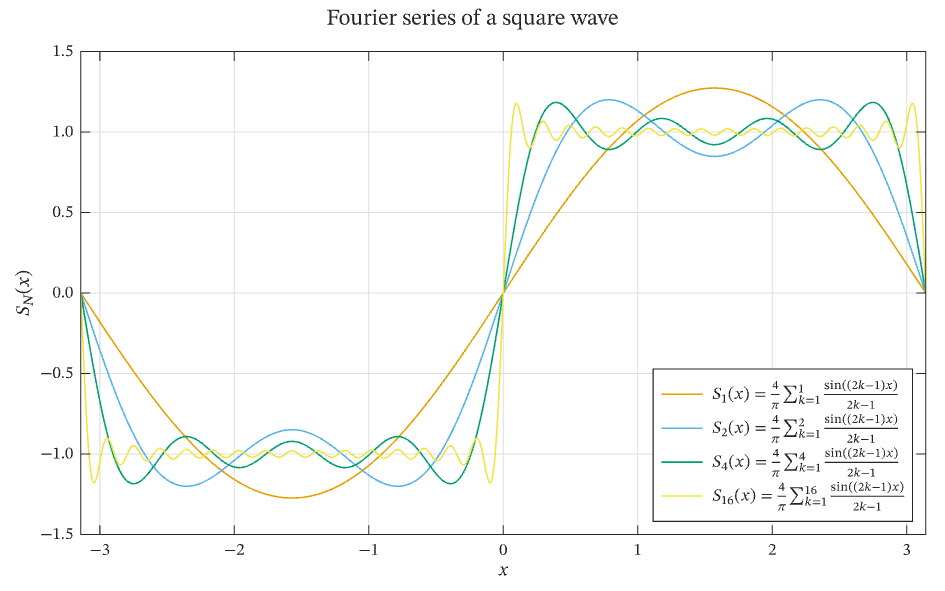
The figure above is live, drawn in the browser by the same engine that draws the viewer: drag it to pan, and click it to zoom with the wheel. Download the PDF for the vector figure that IronLAB exports, or read how to embed a figure of your own.
Source
The figure is built by the following code.
use std::f64::consts::PI;

use ironlab::prelude::*;

pub const TITLE: &str = "Legend toggling";
pub const DESCRIPTION: &str = "Four partial sums of the Fourier series of a square wave, named with LaTeX in the \
     legend. In the viewer, click a legend entry to hide or show its series; a hidden series is greyed in the legend \
     and is left out of an exported PDF.";

/// Returns the sum of the first `terms` terms of the Fourier series of a square wave of unit amplitude,
/// S_N(x) = (4/π) Σ_{k=1}^{N} sin((2k − 1)x) / (2k − 1).
fn square_wave_partial_sum(x: f64, terms: u32) -> f64 {
    let mut sum = 0.0;
    for k in 1..=terms {
        let n = f64::from(2 * k - 1);
        sum += (n * x).sin() / n;
    }
    4.0 / PI * sum
}

pub fn figure() -> Figure {
    let x = linspace(-PI, PI, 801);

    let mut fig = Figure::new()
        .size_mm(160.0, 100.0)
        .title("Fourier series of a square wave")
        .label("line")
        .label("legend")
        .label("export")
        .label("interaction")
        .label("latex")
        .label("signals")
        .parameter("dimensionality", "2D")
        .parameter("artists", 4)
        .parameter("data_points", 6408)
        .parameter("has_legend", true);
    let mut ax = fig.axes(0, 0);
    for terms in [1, 2, 4, 16] {
        let partial_sum: Vec<f64> = x
            .iter()
            .map(|&x| square_wave_partial_sum(x, terms))
            .collect();
        // Doubled braces are literal braces in a Rust format string, so {{{terms}}} becomes {4} in the LaTeX.
        ax.plot(&x, &partial_sum).display_name(format!(
            r"$S_{{{terms}}}(x) = \frac{{4}}{{\pi}} \sum_{{k=1}}^{{{terms}}} \frac{{\sin((2k-1)x)}}{{2k-1}}$"
        ));
    }
    ax.xlabel("$x$")
        .ylabel("$S_N(x)$")
        .xlim(-PI, PI)
        .ylim(-1.5, 1.5)
        .grid(true)
        .legend(LegendLocation::SouthEast);
    fig
}