Lines and markers
A damped oscillation plotted as lines with markers at the samples, a dashed line without markers and a dotted envelope. Series with display names appear in the legend, and the axis labels are typeset with LaTeX.
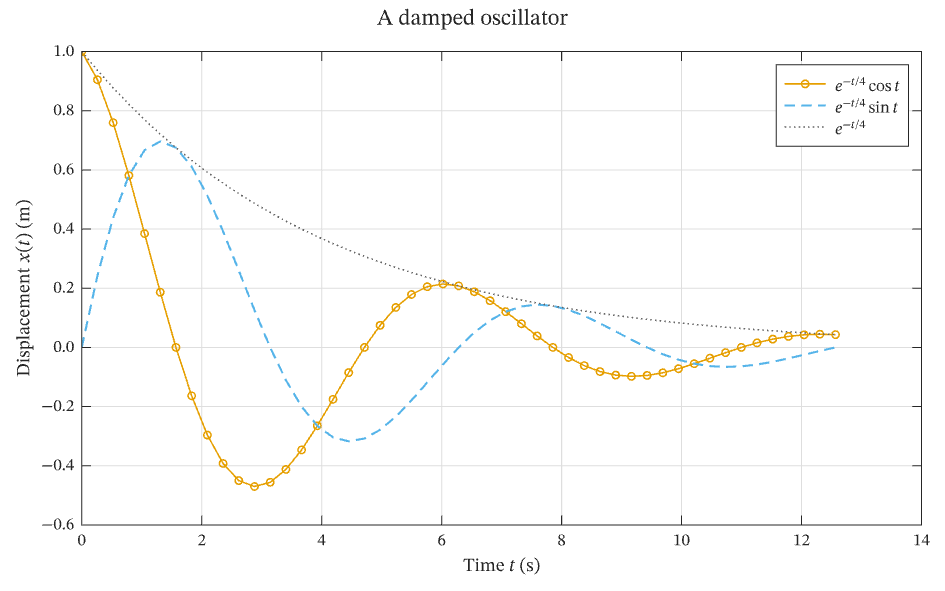
Select the image, or download the PDF, to open the vector figure exported by IronLAB.
Source
The figure is built by the following code.
use std::f64::consts::PI;

use ironlab::prelude::*;

pub const TITLE: &str = "Lines and markers";
pub const DESCRIPTION: &str = "A damped oscillation plotted as lines with markers at the samples, a dashed line \
     without markers and a dotted envelope. Series with display names appear in the legend, and the axis labels are \
     typeset with LaTeX.";

pub fn figure() -> Figure {
    let t = linspace(0.0, 4.0 * PI, 49);
    // A cosine and a sine whose amplitudes both decay within the envelope e^(-t/4).
    let envelope: Vec<f64> = t.iter().map(|t| (-t / 4.0).exp()).collect();
    let damped_cosine: Vec<f64> = t.iter().map(|t| (-t / 4.0).exp() * t.cos()).collect();
    let damped_sine: Vec<f64> = t.iter().map(|t| (-t / 4.0).exp() * t.sin()).collect();

    let mut fig = Figure::new()
        .size_mm(160.0, 100.0)
        .title("A damped oscillator");
    let mut ax = fig.axes(0, 0);
    ax.plot(&t, &damped_cosine)
        .display_name(r"$e^{-t/4} \cos t$")
        .marker(Marker::Circle)
        .marker_size(3.5);
    ax.plot(&t, &damped_sine)
        .display_name(r"$e^{-t/4} \sin t$")
        .dash(Dash::Dashed)
        .line_width(1.0);
    ax.plot(&t, &envelope)
        .display_name(r"$e^{-t/4}$")
        .color(Color::rgb(0.4, 0.4, 0.4))
        .dash(Dash::Dotted);
    ax.xlabel(r"Time $t$ (s)")
        .ylabel(r"Displacement $x(t)$ (m)")
        .grid(true)
        .legend(LegendLocation::NorthEast);
    fig
}