Mapped image
The Julia field drawn as a scalar image through a continuous colour scale with the magma colormap, beneath black isolines of the same field. The values inside a disc are set to NaN, and a colour scale draws nothing for a value that is not finite by default, so the axes background shows through the disc.
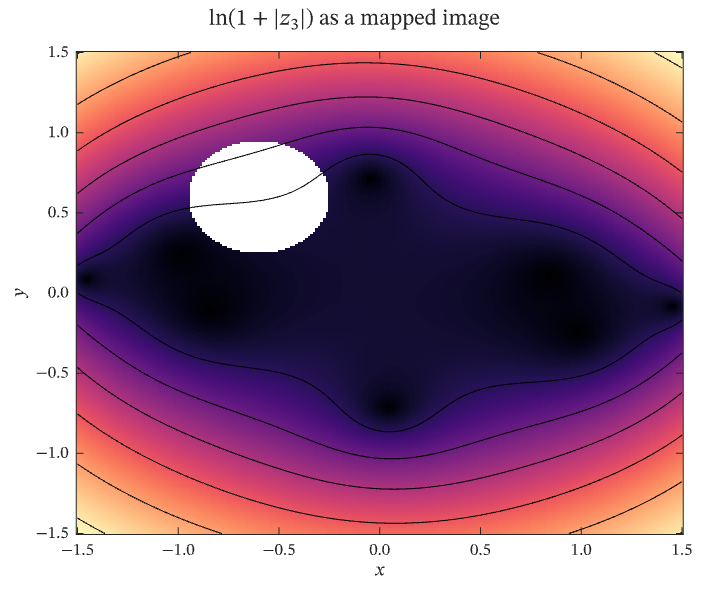
The figure above is live, drawn in the browser by the same engine that draws the viewer: drag it to pan, and click it to zoom with the wheel. Download the PDF for the vector figure that IronLAB exports, or read how to embed a figure of your own.
Source
The figure is built by the following code. Its data comes from the functions on the data helpers page.
use ironlab::prelude::*;

use crate::fields::*;

pub const TITLE: &str = "Mapped image";
pub const DESCRIPTION: &str = "The Julia field drawn as a scalar image through a continuous colour scale with the \
     magma colormap, beneath black isolines of the same field. The values inside a disc are set to NaN, and a colour \
     scale draws nothing for a value that is not finite by default, so the axes background shows through the disc.";

/// The centre of the disc within which the field is undefined.
const HOLE_CENTRE: (f64, f64) = (-0.6, 0.6);

/// The radius of the disc within which the field is undefined.
const HOLE_RADIUS: f64 = 0.35;

pub fn figure() -> Figure {
    let (x, y, z) = julia_grid(241);
    // The values inside the disc are undefined, as the readings under a dead region of a sensor would be.
    let masked = Matrix::from_fn(y.len(), x.len(), |row, col| {
        let (dx, dy) = (x[col] - HOLE_CENTRE.0, y[row] - HOLE_CENTRE.1);
        if dx.hypot(dy) < HOLE_RADIUS {
            f64::NAN
        } else {
            z[(row, col)]
        }
    });

    let mut fig = Figure::new()
        .size_mm(120.0, 100.0)
        .title(r"$\ln(1 + |z_3|)$ as a mapped image")
        .tag("contour")
        .tag("image")
        .tag("overlay")
        .tag("transparency")
        .parameter("dimensionality", "2D")
        .parameter("artists", 2)
        .parameter("data_points", 116_644)
        .parameter("has_legend", false);
    let mut ax = fig.axes(0, 0);
    ax.scalar_image(&masked)
        .pixel_columns(DOMAIN_MIN, DOMAIN_MAX)
        .pixel_rows(DOMAIN_MIN, DOMAIN_MAX);
    ax.contour(&x, &y, &z)
        .levels(12)
        .color(Color::BLACK)
        .line_width(0.5);
    ax.color_scale().colormap(Colormap::Magma);
    ax.xlabel("$x$").ylabel("$y$");
    fig
}