Markers over a surface
A synthetic hill drawn as a surface coloured by its elevation, with the survey points measured on it drawn as markers of two kinds, points measured by GNSS and points measured by total station, and the features of the site: a road over the southern foot coloured by its gradient, a footpath to the summit, the benchmarks of the survey and the trig pillar on the summit. Two boxed legend panels, each headed by its title, are stacked beside the plot in rows fitted to them. The first keys the survey in one column: the two kinds of marker as ordinary entries, then the colour scale of the surface as a bar item, a vertical colourbar seven rows long centred on the column of samples. The second keys the site in two columns: the bar of the road's gradient, five rows long, in the first, and the four features in the second.
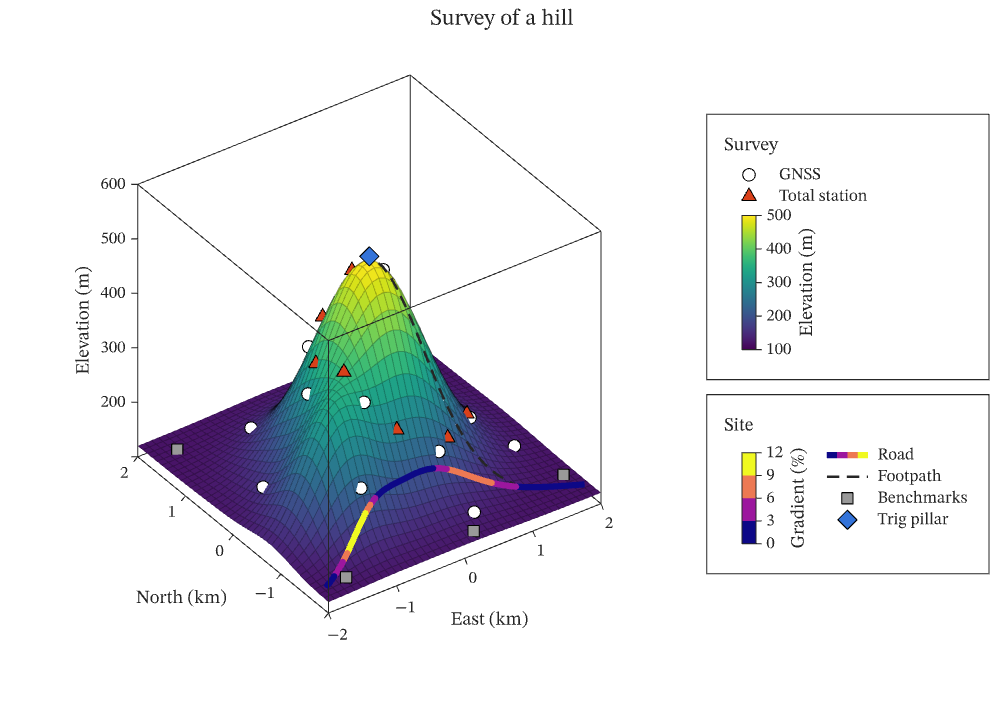
The figure above is live, drawn in the browser by the same engine that draws the viewer: drag it to pan, and click it to zoom with the wheel. Download the PDF for the vector figure that IronLAB exports, or read how to embed a figure of your own.
Source
The figure is built by the following code.
use ironlab::prelude::*;

pub const TITLE: &str = "Markers over a surface";
pub const DESCRIPTION: &str = "A synthetic hill drawn as a surface coloured by its elevation, with the survey \
     points measured on it drawn as markers of two kinds, points measured by GNSS and points measured by total \
     station, and the features of the site: a road over the southern foot coloured by its gradient, a footpath to \
     the summit, the benchmarks of the survey and the trig pillar on the summit. Two boxed legend panels, each \
     headed by its title, are stacked beside the plot in rows fitted to them. The first keys the survey in one \
     column: the two kinds of marker as ordinary entries, then the colour scale of the surface as a bar item, a \
     vertical colourbar seven rows long centred on the column of samples. The second keys the site in two \
     columns: the bar of the road's gradient, five rows long, in the first, and the four features in the second.";

/// The number of grid nodes along each side of the surface.
const NODES: usize = 41;

/// Returns the elevation, in metres, of the hill at `x`, `y` kilometres from its centre: a main summit and a lower
/// shoulder to the south-west, on a plain at 120 m.
fn elevation(x: f64, y: f64) -> f64 {
    let summit = 380.0 * (-(x * x + y * y) / 0.9).exp();
    let shoulder = 160.0 * (-((x + 1.1).powi(2) + (y + 0.8).powi(2)) / 0.35).exp();
    120.0 + summit + shoulder
}

/// Returns the points of a survey, `count` of them on a spiral of the given turns and radius, each on the surface.
fn survey(count: usize, turns: f64, radius: f64, phase: f64) -> (Vec<f64>, Vec<f64>, Vec<f64>) {
    let mut x = Vec::with_capacity(count);
    let mut y = Vec::with_capacity(count);
    let mut z = Vec::with_capacity(count);
    for k in 0..count {
        let t = (k as f64 + 0.5) / count as f64;
        let angle = phase + std::f64::consts::TAU * turns * t;
        let r = radius * t.sqrt();
        let (px, py) = (r * angle.cos(), r * angle.sin());
        x.push(px);
        y.push(py);
        // Slightly above the surface, so that the marker is not hidden by the face it stands on.
        z.push(elevation(px, py) + 6.0);
    }
    (x, y, z)
}

/// The number of points along the road.
const ROAD: usize = 41;

/// The number of points along the footpath.
const PATH: usize = 21;

/// The places of the benchmarks of the survey, on the plain around the hill, in kilometres.
const BENCHMARKS: [(f64, f64); 5] = [(-1.7, 1.6), (1.7, 1.7), (1.8, -1.5), (-1.6, -1.8), (0.2, -1.9)];

/// Returns the points of the road, which crosses the southern foot of the hill from west to east, over the shoulder,
/// each slightly above the surface, together with its gradient over each segment, in per cent.
fn road() -> (Vec<f64>, Vec<f64>, Vec<f64>, Vec<f64>) {
    let x = linspace(-1.9, 1.9, ROAD);
    let y: Vec<f64> = (0..ROAD)
        .map(|k| -1.8 + 0.6 * (std::f64::consts::PI * k as f64 / (ROAD - 1) as f64).sin())
        .collect();
    let ground: Vec<f64> = x.iter().zip(&y).map(|(&x, &y)| elevation(x, y)).collect();
    // A rise in metres over a run in kilometres, as a percentage, is the rise over ten times the run.
    let gradient = (1..ROAD)
        .map(|k| {
            let run = (x[k] - x[k - 1]).hypot(y[k] - y[k - 1]);
            (ground[k] - ground[k - 1]).abs() / (10.0 * run)
        })
        .collect();
    let z = ground.iter().map(|z| z + 6.0).collect();
    (x, y, z, gradient)
}

/// Returns the points of the footpath, which leaves the road east of the hill and climbs straight to the summit, each
/// slightly above the surface.
fn footpath() -> (Vec<f64>, Vec<f64>, Vec<f64>) {
    let x = linspace(1.2, 0.05, PATH);
    let y = linspace(-1.47, -0.05, PATH);
    let z = x.iter().zip(&y).map(|(&x, &y)| elevation(x, y) + 6.0).collect();
    (x, y, z)
}

pub fn figure() -> Figure {
    let x = linspace(-2.0, 2.0, NODES);
    let y = linspace(-2.0, 2.0, NODES);
    let z = Matrix::from_fn(NODES, NODES, |row, col| elevation(x[col], y[row]));
    let surveyed = 3 * (14 + 9);
    let site = 4 * ROAD - 1 + 3 * PATH + 3 * BENCHMARKS.len() + 3;

    // The plot spans every row; the two keys lie in the middle rows of the column beside it, each row fitted to its
    // key so that each border is drawn close round its entries, and the rows above and below share what remains.
    let mut fig = Figure::new()
        .size_mm(170.0, 120.0)
        .tiles(4, 2)
        .row_weights([
            TrackSize::Weight(1.0),
            TrackSize::Fit,
            TrackSize::Fit,
            TrackSize::Weight(1.0),
        ])
        .fit_col(1)
        .title("Survey of a hill")
        .tag("surface")
        .tag("scatter")
        .tag("line")
        .tag("color-scale")
        .tag("legend")
        .tag("measurements")
        .parameter("dimensionality", "3D")
        .parameter("artists", 7)
        .parameter("data_points", (2 * NODES + NODES * NODES + surveyed + site) as i64)
        .parameter("has_legend", true);
    let height = fig
        .color_scale()
        .colormap(Colormap::Viridis)
        .limits(100.0, 500.0)
        .tick_step(100.0)
        .title("Elevation (m)")
        .id();
    let steepness = fig
        .color_scale()
        .colormap(Colormap::Plasma)
        .discrete([0.0, 3.0, 6.0, 9.0, 12.0])
        .title("Gradient (%)")
        .id();
    // Both keys are aligned with the left edge of the column, which the wider of the two sets.
    let survey_key = fig
        .panel(1, 1)
        .title("Survey")
        .align(PanelLocation::NorthWest)
        .legend()
        .id();

    let mut ax = fig.axes_span(0, 0, 4, 1);
    ax.surf(&x, &y, &z)
        .color_scale(height)
        .edge_color(Color::rgba(0.0, 0.0, 0.0, 0.25));
    let (gx, gy, gz) = survey(14, 2.0, 1.8, 0.0);
    let gnss = ax
        .scatter3(&gx, &gy, &gz)
        .label("GNSS")
        .marker(Marker::Circle)
        .marker_size(6.0)
        .marker_face(Color::WHITE)
        .marker_edge(Color::BLACK)
        .id();
    let (tx, ty, tz) = survey(9, 1.0, 1.4, 1.3);
    let station = ax
        .scatter3(&tx, &ty, &tz)
        .label("Total station")
        .marker(Marker::TriangleUp)
        .marker_size(7.0)
        .marker_face(Color::rgb(0.85, 0.25, 0.10))
        .marker_edge(Color::BLACK)
        .id();
    let (rx, ry, rz, gradient) = road();
    let road = ax
        .plot3(&rx, &ry, &rz)
        .label("Road")
        .color_scale(steepness)
        .color_data(gradient)
        .line_width(3.0)
        .id();
    let (px, py, pz) = footpath();
    let path = ax
        .plot3(&px, &py, &pz)
        .label("Footpath")
        .color(Color::rgb(0.15, 0.15, 0.15))
        .dash(Dash::Dashed)
        .line_width(1.2)
        .id();
    let bx: Vec<f64> = BENCHMARKS.iter().map(|b| b.0).collect();
    let by: Vec<f64> = BENCHMARKS.iter().map(|b| b.1).collect();
    let bz: Vec<f64> = BENCHMARKS.iter().map(|&(x, y)| elevation(x, y) + 6.0).collect();
    let benchmarks = ax
        .scatter3(&bx, &by, &bz)
        .label("Benchmarks")
        .marker(Marker::Square)
        .marker_size(6.0)
        .marker_face(Color::rgb(0.6, 0.6, 0.6))
        .marker_edge(Color::BLACK)
        .id();
    let pillar = ax
        .scatter3([0.0], [0.0], [elevation(0.0, 0.0) + 10.0])
        .label("Trig pillar")
        .marker(Marker::Diamond)
        .marker_size(8.0)
        .marker_face(Color::rgb(0.2, 0.45, 0.85))
        .marker_edge(Color::BLACK)
        .id();
    ax.xlabel("East (km)")
        .ylabel("North (km)")
        .zlabel("Elevation (m)")
        .view(-35.0, 35.0)
        .legend_in(survey_key);

    // The survey key lists the two kinds of survey point and then the scale of the surface as a bar item, long
    // enough for the title of the scale to lie along it.
    fig.panel(1, 1)
        .legend()
        .item(gnss)
        .item(station)
        .item(LegendItem::color_scale(height).with_rows(7));
    // The site key fills its columns from the top, column by column: the bar of the gradient takes the five rows of
    // the first column, and the four features fill the second.
    fig.panel(2, 1)
        .title("Site")
        .align(PanelLocation::NorthWest)
        .legend()
        .item(LegendItem::color_scale(steepness).with_rows(5))
        .item(road)
        .item(path)
        .item(benchmarks)
        .item(pillar)
        .columns(LegendEntryColumns::Count(2));
    fig
}