Shared legend panel
Three days of synthetic hourly readings from five weather stations, with one legend panel, titled "Key", in the sixth tile. Every station plots its air temperature and dew point, and the three coastal stations also plot the sea surface temperature. Entries with the same display name and the same look are listed once, so the panel holds three entries for thirteen series; in the viewer, clicking an entry hides that series in every axes.
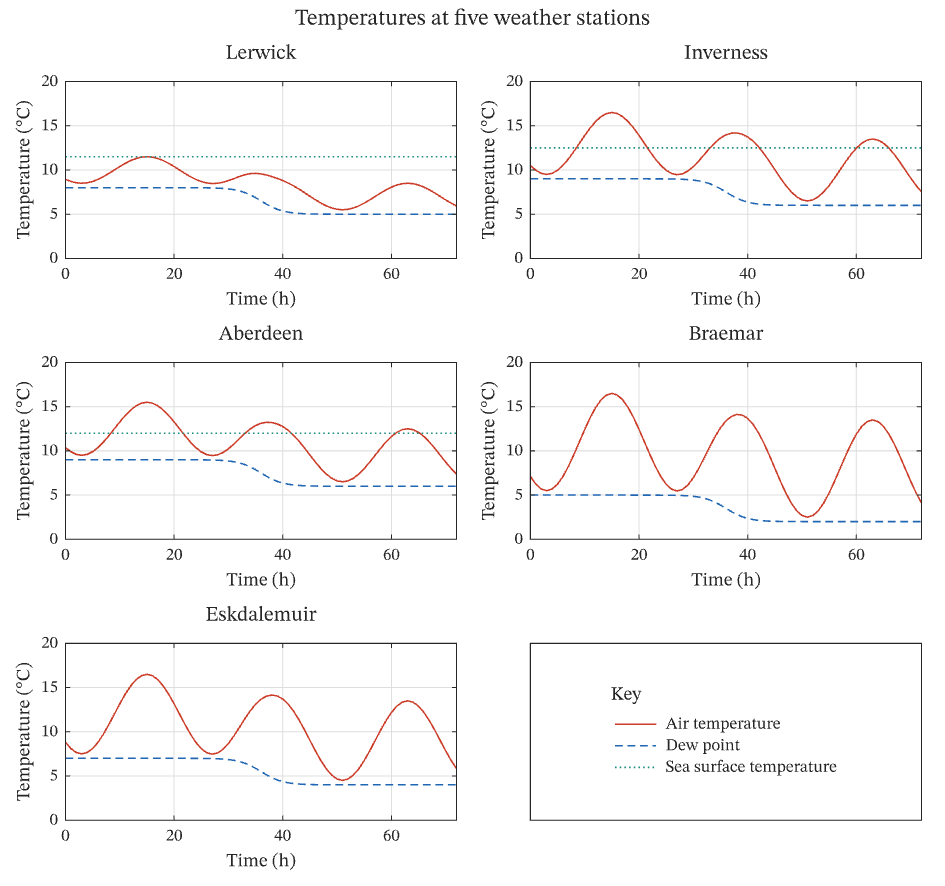
The figure above is live, drawn in the browser by the same engine that draws the viewer: drag it to pan, and click it to zoom with the wheel. Download the PDF for the vector figure that IronLAB exports, or read how to embed a figure of your own.
Source
The figure is built by the following code.
use std::f64::consts::PI;

use ironlab::prelude::*;

pub const TITLE: &str = "Shared legend panel";
pub const DESCRIPTION: &str = "Three days of synthetic hourly readings from five weather stations, with one legend \
     panel, titled \"Key\", in the sixth tile. Every station plots its air temperature and dew point, and the three coastal stations \
     also plot the sea surface temperature. Entries with the same display name and the same look are listed once, so \
     the panel holds three entries for thirteen series; in the viewer, clicking an entry hides that series in every \
     axes.";

const AIR: Color = Color::rgb(0.80, 0.24, 0.16);
const DEW_POINT: Color = Color::rgb(0.13, 0.40, 0.70);
const SEA: Color = Color::rgb(0.10, 0.55, 0.50);

/// Each station's name, the mean and the daily range of its air temperature, and the temperature of the sea beside
/// it if it is on the coast, in degrees Celsius.
const STATIONS: [(&str, f64, f64, Option<f64>); 5] = [
    ("Lerwick", 10.0, 3.0, Some(11.5)),
    ("Inverness", 13.0, 7.0, Some(12.5)),
    ("Aberdeen", 12.5, 6.0, Some(12.0)),
    ("Braemar", 11.0, 11.0, None),
    ("Eskdalemuir", 12.0, 9.0, None),
];

pub fn figure() -> Figure {
    let hours = linspace(0.0, 72.0, 73);
    // A cold front passes on the second day and lowers every temperature by up to 3 °C.
    let front: Vec<f64> = hours
        .iter()
        .map(|t| -1.5 * (1.0 + ((t - 36.0) / 4.0).tanh()))
        .collect();

    let mut fig = Figure::new()
        .size_mm(160.0, 150.0)
        .tiles(3, 2)
        .title("Temperatures at five weather stations")
        .tag("line")
        .tag("subplots")
        .tag("legend")
        .tag("dashes")
        .tag("measurements")
        .parameter("dimensionality", "2D")
        .parameter("artists", 13)
        .parameter("data_points", 1898)
        .parameter("has_legend", true);
    // The sixth tile holds the legend panel that every axes lists its entries in.
    let key = fig.panel(2, 1).title("Key").id();

    for (k, (name, mean, range, sea)) in STATIONS.into_iter().enumerate() {
        // The air is warmest at 15:00 and coolest at 03:00, when it cools to just above the dew point.
        let air: Vec<f64> = hours
            .iter()
            .zip(&front)
            .map(|(t, front)| mean + front + range / 2.0 * (2.0 * PI * (t - 9.0) / 24.0).sin())
            .collect();
        let dew_point: Vec<f64> = front
            .iter()
            .map(|front| mean - range / 2.0 - 0.5 + front)
            .collect();

        let mut ax = fig.axes(k as u32 / 2, k as u32 % 2);
        // The same display name and the same look in every axes make one entry in the panel.
        ax.plot(&hours, &air)
            .label("Air temperature")
            .color(AIR);
        ax.plot(&hours, &dew_point)
            .label("Dew point")
            .color(DEW_POINT)
            .dash(Dash::Dashed);
        if let Some(sea) = sea {
            ax.plot(&hours, vec![sea; hours.len()])
                .label("Sea surface temperature")
                .color(SEA)
                .dash(Dash::Dotted);
        }
        ax.title(name)
            .xlabel("Time (h)")
            .ylabel("Temperature (°C)")
            .xlim(0.0, 72.0)
            .ylim(0.0, 20.0)
            .grid(true)
            .legend_in(key);
    }
    fig
}