Polar histograms
The headings of 2000 waves recorded by a buoy, in degrees clockwise from north, drawn from a seeded mixture of a swell arriving from just west of north and a wind sea from the south-south-west. The swell straddles north, so many of its headings are recorded just below 360° and many just above 0°; a polar histogram wraps every angle into one turn before binning it, and bins over the whole turn, so the last bin adjoins the first and the swell is counted as one lobe. On the left the 24 bins of 15° are drawn as bars, which in polar axes are wedges; on the right the same sample is drawn in the step style, whose outline runs along an arc at the count of each bin and joins neighbouring bins radially.
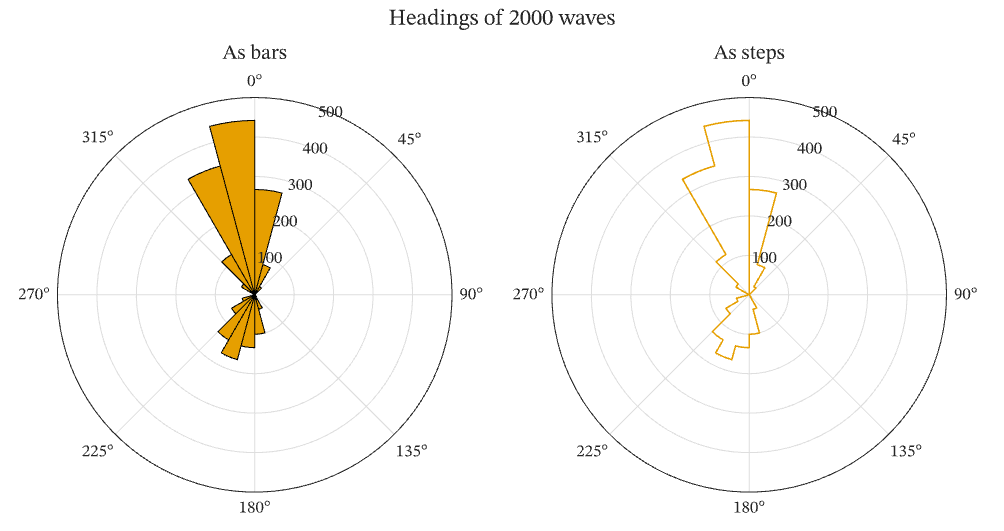
The figure above is live, drawn in the browser by the same engine that draws the viewer: drag it to pan, and click it to zoom with the wheel. Download the PDF for the vector figure that IronLAB exports, or read how to embed a figure of your own.
Source
The figure is built by the following code.
use ironlab::prelude::*;

pub const TITLE: &str = "Polar histograms";
pub const DESCRIPTION: &str = "The headings of 2000 waves recorded by a buoy, in degrees clockwise from north, drawn \
     from a seeded mixture of a swell arriving from just west of north and a wind sea from the south-south-west. The \
     swell straddles north, so many of its headings are recorded just below 360° and many just above 0°; a polar \
     histogram wraps every angle into one turn before binning it, and bins over the whole turn, so the last bin \
     adjoins the first and the swell is counted as one lobe. On the left the 24 bins of 15° are drawn as bars, \
     which in polar axes are wedges; on the right the same sample is drawn in the step style, whose outline runs \
     along an arc at the count of each bin and joins neighbouring bins radially.";

/// The number of waves recorded.
const WAVES: usize = 2000;

/// The number of bins over the turn.
const BINS: u32 = 24;

/// The two wave systems: the share of the waves each holds, its mean heading and the standard deviation of its
/// headings, in degrees.
const SYSTEMS: [(f64, f64, f64); 2] = [(0.65, 350.0, 18.0), (0.35, 200.0, 25.0)];

/// A small deterministic generator, so that the sample is the same on every run.
struct SplitMix64(u64);

impl SplitMix64 {
    /// Returns a number drawn uniformly from `(0, 1)`.
    fn unit(&mut self) -> f64 {
        self.0 = self.0.wrapping_add(0x9e37_79b9_7f4a_7c15);
        let mut z = self.0;
        z = (z ^ (z >> 30)).wrapping_mul(0xbf58_476d_1ce4_e5b9);
        z = (z ^ (z >> 27)).wrapping_mul(0x94d0_49bb_1331_11eb);
        z ^= z >> 31;
        ((z >> 11) as f64 + 0.5) / (1u64 << 53) as f64
    }

    /// Returns a number drawn from the standard normal distribution, by the Box–Muller transform.
    fn normal(&mut self) -> f64 {
        let (u, v) = (self.unit(), self.unit());
        (-2.0 * u.ln()).sqrt() * (std::f64::consts::TAU * v).cos()
    }
}

/// Returns the headings of the waves, in degrees, as a buoy reports them: in `[0, 360)`.
fn headings() -> Vec<f64> {
    let mut rng = SplitMix64(23);
    (0..WAVES)
        .map(|_| {
            let (_, mean, sigma) = if rng.unit() < SYSTEMS[0].0 {
                SYSTEMS[0]
            } else {
                SYSTEMS[1]
            };
            (mean + sigma * rng.normal()).rem_euclid(360.0)
        })
        .collect()
}

pub fn figure() -> Figure {
    let headings = headings();
    let mut fig = Figure::new()
        .size_mm(170.0, 90.0)
        .tiles(1, 2)
        .title("Headings of 2000 waves")
        .tag("polar")
        .tag("polar-histogram")
        .tag("histogram")
        .tag("bar")
        .tag("stairs")
        .tag("subplots")
        .parameter("dimensionality", "2D")
        .parameter("artists", 2)
        .parameter("data_points", 146)
        .parameter("has_legend", false);
    for (col, style, title) in [
        (0, HistStyle::Bar, "As bars"),
        (1, HistStyle::Step, "As steps"),
    ] {
        let mut ax = fig.polar_axes(0, col);
        ax.theta_zero(ThetaZero::North).clockwise(true);
        ax.polar_hist(&headings).bins(Bins::Count(BINS)).style(style);
        ax.rlim(0.0, 500.0)
            .ytick_step(100.0)
            .title(title);
    }
    fig
}