Quiver
Arrows showing the gradient of the Julia field on a coarse grid, drawn over isolines of the field on a fine grid. The arrows point uphill and cross the isolines at right angles.
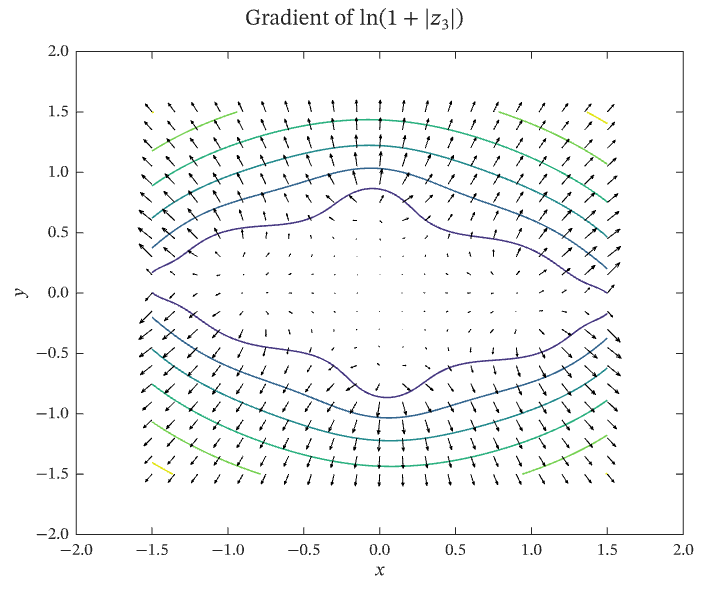
Select the image, or download the PDF, to open the vector figure exported by IronLAB.
Source
The figure is built by the following code. Its data comes from the functions on the data helpers page.
use ironlab::prelude::*;

use crate::fields::*;

pub const TITLE: &str = "Quiver";
pub const DESCRIPTION: &str = "Arrows showing the gradient of the Julia field on a coarse grid, drawn over isolines \
     of the field on a fine grid. The arrows point uphill and cross the isolines at right angles.";

pub fn figure() -> Figure {
    // A fine grid gives smooth isolines; a coarse grid keeps the arrows far enough apart to read.
    let (x_fine, y_fine, z_fine) = julia_grid(121);
    let (x, y, z) = julia_grid(21);
    let (dzdx, dzdy) = gradient(&x, &y, &z);
    // quiver takes the position of every arrow, so expand the grid vectors to the coordinates of every node.
    let (xx, yy) = meshgrid(&x, &y);

    let mut fig = Figure::new()
        .size_mm(120.0, 100.0)
        .title(r"Gradient of $\ln(1 + |z_3|)$");
    let mut ax = fig.axes(0, 0);
    ax.contour(&x_fine, &y_fine, &z_fine).levels(12);
    ax.quiver(xx.values(), yy.values(), dzdx.values(), dzdy.values())
        .color(Color::BLACK)
        .line_width(0.5)
        .display_name(r"$\nabla f$");
    ax.xlabel("$x$").ylabel("$y$");
    fig
}