Three-dimensional quiver
Upward unit normals of the Julia field's surface, drawn as arrows from the nodes of a coarse grid over the surface itself.
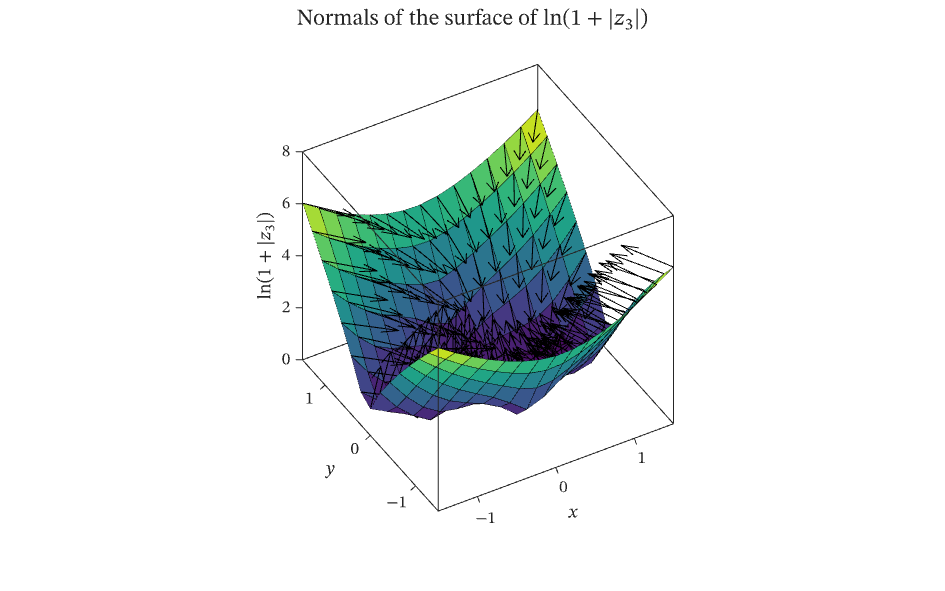
The figure above is live, drawn in the browser by the same engine that draws the viewer: drag it to pan, and click it to zoom with the wheel. Download the PDF for the vector figure that IronLAB exports, or read how to embed a figure of your own.
Source
The figure is built by the following code. Its data comes from the functions on the data helpers page.
use ironlab::prelude::*;

use crate::fields::*;

pub const TITLE: &str = "Three-dimensional quiver";
pub const DESCRIPTION: &str = "Upward unit normals of the Julia field's surface, drawn as arrows from the nodes of a \
     coarse grid over the surface itself.";

pub fn figure() -> Figure {
    let (x, y, z) = julia_grid(15);
    let (nx, ny, nz) = surface_normals(&x, &y, &z);
    // quiver3 takes the position of every arrow, so expand the grid vectors to the coordinates of every node; each
    // arrow starts on the surface, at height z.
    let (xx, yy) = meshgrid(&x, &y);

    let mut fig = Figure::new()
        .size_mm(160.0, 100.0)
        .title(r"Normals of the surface of $\ln(1 + |z_3|)$")
        .label("quiver")
        .label("surface")
        .label("gradient")
        .label("overlay")
        .parameter("dimensionality", "3D")
        .parameter("artists", 2)
        .parameter("data_points", 1605)
        .parameter("has_legend", false);
    let mut ax = fig.axes3(0, 0);
    ax.surf(&x, &y, &z).edge_width(0.25);
    ax.quiver3(
        xx.values(),
        yy.values(),
        z.values(),
        nx.values(),
        ny.values(),
        nz.values(),
    )
    .color(Color::BLACK)
    .line_width(0.5)
    .display_name(r"$\hat{n}$");
    ax.xlabel("$x$")
        .ylabel("$y$")
        .zlabel(r"$\ln(1 + |z_3|)$")
        .view(-30.0, 40.0);
    fig
}