Radar chart
Three design candidates for a small electric aircraft scored against five criteria, each score normalised to the range from 0 (worst of the field) to 1 (best), so that higher is better on every spoke and one radial scale serves them all. The axes are polar, with one angle unit per criterion, so that spoke k lies at angle k; the first spoke points north and the others follow clockwise. Each candidate is an ordinary series through its five scores with the first score repeated at the end, so that the outline closes with a straight edge, filled translucently in its own colour down to the centre. The edges between spokes are straight chords, because a radar outline joins data points and does not follow the circles of the grid.
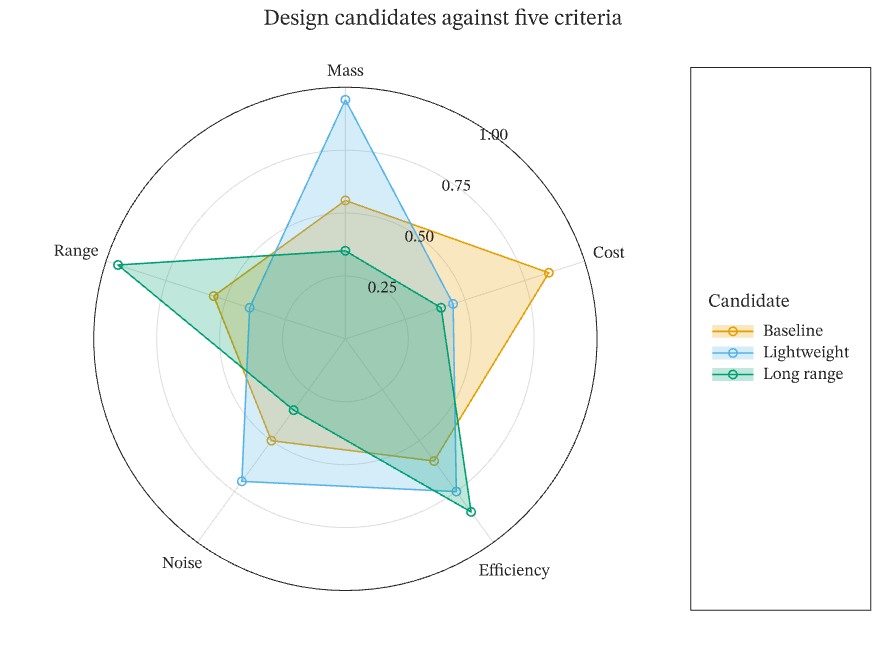
The figure above is live, drawn in the browser by the same engine that draws the viewer: drag it to pan, and click it to zoom with the wheel. Download the PDF for the vector figure that IronLAB exports, or read how to embed a figure of your own.
Source
The figure is built by the following code.
use ironlab::prelude::*;

pub const TITLE: &str = "Radar chart";
pub const DESCRIPTION: &str = "Three design candidates for a small electric aircraft scored against five criteria, \
     each score normalised to the range from 0 (worst of the field) to 1 (best), so that higher is better on every \
     spoke and one radial scale serves them all. The axes are polar, with one angle unit per criterion, so that \
     spoke k lies at angle k; the first spoke points north and the others follow clockwise. Each candidate is an \
     ordinary series through its five scores with the first score repeated at the end, so that the outline closes \
     with a straight edge, filled translucently in its own colour down to the centre. The edges between spokes are \
     straight chords, because a radar outline joins data points and does not follow the circles of the grid.";

/// The criteria, one per spoke, in clockwise order from the north.
const CRITERIA: [&str; 5] = ["Mass", "Cost", "Efficiency", "Noise", "Range"];

/// Each candidate and its normalised score against each criterion.
const CANDIDATES: [(&str, [f64; 5]); 3] = [
    ("Baseline", [0.55, 0.85, 0.60, 0.50, 0.55]),
    ("Lightweight", [0.95, 0.45, 0.75, 0.70, 0.40]),
    ("Long range", [0.35, 0.40, 0.85, 0.35, 0.95]),
];

pub fn figure() -> Figure {
    let mut fig = Figure::new()
        .size_mm(150.0, 110.0)
        .tiles(1, 2)
        .col_weights([TrackSize::Weight(1.0), TrackSize::Fit])
        .title("Design candidates against five criteria")
        .tag("polar")
        .tag("radar")
        .tag("line")
        .tag("legend")
        .parameter("dimensionality", "2D")
        .parameter("artists", 3)
        .parameter("data_points", 36)
        .parameter("has_legend", true);
    let key = fig.panel(0, 1).title("Candidate").id();
    let mut ax = fig.polar_axes(0, 0);
    ax.spokes(&CRITERIA)
        .rlim(0.0, 1.0)
        .ytick_step(0.25);
    for (name, scores) in CANDIDATES {
        ax.radar(scores).label(name);
    }
    ax.legend_in(key);
    fig
}