Colourbar shared by a row
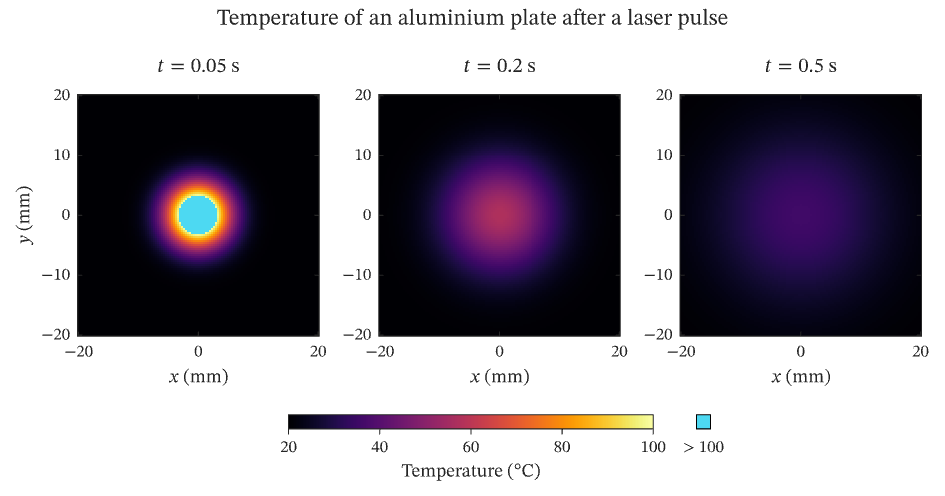
The temperature of a thin aluminium plate at three times after a laser pulse heats a spot 2 mm wide at its centre by 400 K. Heat diffuses outward with the diffusivity of aluminium, so the spot widens and its peak falls as the energy spreads over a larger area. The three images name one colour scale, fixed from 20 to 100 °C, and one horizontal colourbar in a panel spanning the row beneath them shows it; the bar and its key together are half as long as the row of three plot boxes, centred beneath it, and the title of the scale lies along the bar, below its labels. The first frame is hotter than the top of the scale at its centre, so values above 100 °C are drawn in cyan rather than clipped to the last colour, and the key beside the bar says so.
The figure above is live, drawn in the browser by the same engine that draws the viewer: drag it to pan, and click it to zoom with the wheel. Download the PDF for the vector figure that IronLAB exports, or read how to embed a figure of your own.
Source
The figure is built by the following code.
use ironlab::prelude::*;

pub const TITLE: &str = "Colourbar shared by a row";
pub const DESCRIPTION: &str = "The temperature of a thin aluminium plate at three times after a laser pulse heats a \
     spot 2 mm wide at its centre by 400 K. Heat diffuses outward with the diffusivity of aluminium, so the spot \
     widens and its peak falls as the energy spreads over a larger area. The three images name one colour scale, \
     fixed from 20 to 100 °C, and one horizontal colourbar in a panel spanning the row beneath them shows it; the \
     bar and its key together are half as long as the row of three plot boxes, centred beneath it, and the title of \
     the scale lies along the bar, below its labels. The first frame is hotter than the top of \
     the scale at its centre, so values above 100 °C are drawn in cyan rather than clipped to the last colour, and \
     the key beside the bar says so.";

/// The thermal diffusivity of aluminium, in mm²/s.
const DIFFUSIVITY_MM2_PER_S: f64 = 97.0;

/// The standard deviation of the Gaussian spot that the pulse heats, in millimetres.
const SPOT_MM: f64 = 2.0;

/// The temperature rise at the centre of the spot just after the pulse, in kelvin.
const PEAK_RISE_K: f64 = 400.0;

/// The temperature of the plate before the pulse, in degrees Celsius.
const AMBIENT_C: f64 = 20.0;

/// The number of samples along each side of the field.
const SAMPLES: usize = 121;

/// The times after the pulse at which the plate is shown, in seconds.
const TIMES_S: [f64; 3] = [0.05, 0.2, 0.5];

/// Returns the temperature, in degrees Celsius, at a distance `r` from the centre of the spot, in millimetres, a
/// time `t` after the pulse, in seconds.
///
/// A Gaussian spot in a thin plate whose faces lose no heat stays Gaussian under diffusion: its variance grows by
/// 2αt and, because the energy is conserved, its peak falls by the same factor.
fn temperature(r: f64, t: f64) -> f64 {
    let variance = SPOT_MM * SPOT_MM + 2.0 * DIFFUSIVITY_MM2_PER_S * t;
    AMBIENT_C
        + PEAK_RISE_K * SPOT_MM * SPOT_MM / variance * (-r * r / (2.0 * variance)).exp()
}

pub fn figure() -> Figure {
    let x = linspace(-20.0, 20.0, SAMPLES);

    let mut fig = Figure::new()
        .size_mm(160.0, 84.0)
        .tiles(2, 3)
        .fit_row(1)
        .title("Temperature of an aluminium plate after a laser pulse")
        .tag("image")
        .tag("subplots")
        .tag("color-scale")
        .tag("colorbar")
        .tag("out-of-range")
        .tag("aspect")
        .tag("physics")
        .parameter("dimensionality", "2D")
        .parameter("artists", 3)
        .parameter("data_points", 43_923)
        .parameter("has_legend", false);
    // One scale for the three times, so a colour means one temperature in every frame.
    let shared = fig
        .color_scale()
        .colormap(Colormap::Inferno)
        .limits(AMBIENT_C, 100.0)
        .above(Color::rgb(0.3, 0.85, 0.95))
        .show_key(ColorScaleKey::Above)
        .title("Temperature (°C)")
        .id();

    for (col, t) in TIMES_S.into_iter().enumerate() {
        let field = Matrix::from_fn(SAMPLES, SAMPLES, |row, col| {
            temperature(x[col].hypot(x[row]), t)
        });
        let mut ax = fig.axes(0, col as u32);
        ax.scalar_image(&field)
            .pixel_columns(x[0], x[SAMPLES - 1])
            .pixel_rows(x[0], x[SAMPLES - 1])
            .color_scale(shared);
        ax.title(format!("$t = {t}$ s"))
            .xlabel("$x$ (mm)")
            .aspect(Aspect::Equal);
        if col == 0 {
            ax.ylabel("$y$ (mm)");
        }
    }
    // The bar lies along a panel spanning the row beneath the images, whose height fits the bar, its ticks and its
    // title.
    fig.panel_span(1, 0, 1, 3)
        .colorbar(shared)
        .orientation(ColorbarOrientation::Horizontal);
    fig
}