Three-dimensional scatter
Points of a sunflower spiral lifted to the height of the Julia field and coloured by that height, drawn as filled markers in three dimensions.
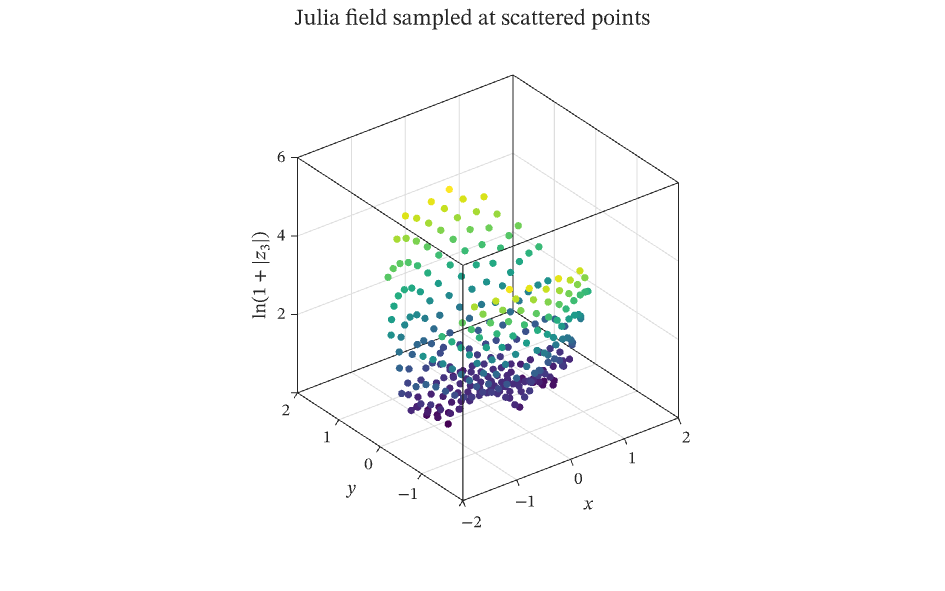
The figure above is live, drawn in the browser by the same engine that draws the viewer: drag it to pan, and click it to zoom with the wheel. Download the PDF for the vector figure that IronLAB exports, or read how to embed a figure of your own.
Source
The figure is built by the following code. Its data comes from the functions on the data helpers page.
use ironlab::prelude::*;

use crate::fields::*;

pub const TITLE: &str = "Three-dimensional scatter";
pub const DESCRIPTION: &str = "Points of a sunflower spiral lifted to the height of the Julia field and coloured by \
     that height, drawn as filled markers in three dimensions.";

pub fn figure() -> Figure {
    let (x, y) = sunflower(300, 1.5);
    let z: Vec<f64> = x.iter().zip(&y).map(|(&x, &y)| julia_field(x, y)).collect();

    let mut fig = Figure::new()
        .size_mm(160.0, 100.0)
        .title("Julia field sampled at scattered points")
        .label("scatter")
        .label("basics")
        .label("markers")
        .parameter("dimensionality", "3D")
        .parameter("artists", 1)
        .parameter("data_points", 1200)
        .parameter("has_legend", false);
    let mut ax = fig.axes3(0, 0);
    ax.scatter3(&x, &y, &z).colors(&z).size(3.0).filled();
    ax.xlabel("$x$")
        .ylabel("$y$")
        .zlabel(r"$\ln(1 + |z_3|)$")
        .grid(true);
    fig
}