Stairs
Stepped outlines of the two kinds that stairs draw. On the left, a converter samples an analogue signal 2 ms apart, quantises each sample to the nearest of the 0.25 V levels of a 4-bit digital-to-analogue converter, and holds it until the next sample, as a zero-order hold does: the held output is drawn as open stairs through values held at the samples, each from its own sample up to the next, over the signal it reconstructs. On the right, the octave-band sound pressure levels of a pump and of the background noise of the room it stands in, values held between the edges of the bands on a logarithmic frequency axis, as an analyser reports them. The pump's spectrum is filled down to its base of 0 dB; the background is drawn as stairs on the same base without a fill, so that both outlines drop to the base at their ends.
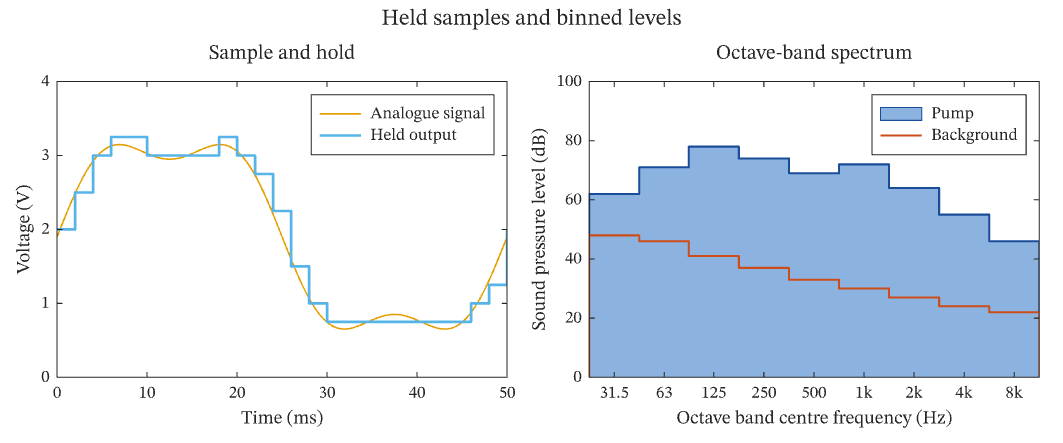
The figure above is live, drawn in the browser by the same engine that draws the viewer: drag it to pan, and click it to zoom with the wheel. Download the PDF for the vector figure that IronLAB exports, or read how to embed a figure of your own.
Source
The figure is built by the following code.
use ironlab::prelude::*;

pub const TITLE: &str = "Stairs";
pub const DESCRIPTION: &str = "Stepped outlines of the two kinds that stairs draw. On the left, a converter \
     samples an analogue signal 2 ms apart, quantises each sample to the nearest of the 0.25 V levels of a 4-bit \
     digital-to-analogue converter, and holds it until the next sample, as a zero-order hold does: the held output is \
     drawn as open stairs through values held at the samples, each from its own sample up to the next, over the \
     signal it reconstructs. On the right, the octave-band sound pressure levels of a pump and of the background \
     noise of the room it stands in, values held between the edges of the bands on a logarithmic frequency axis, as \
     an analyser reports them. The pump's spectrum is filled down to its base of 0 dB; the background is drawn as \
     stairs on the same base without a fill, so that both outlines drop to the base at their ends.";

/// The interval between samples, in milliseconds.
const SAMPLE_MS: f64 = 2.0;

/// The number of samples taken.
const SAMPLES: usize = 26;

/// The step between the output levels of the converter, in volts: 16 levels from 0 to 3.75 V.
const LEVEL_V: f64 = 0.25;

/// Returns the analogue signal, in volts, at the time `t` in milliseconds: an offset sine of 20 Hz with its third
/// harmonic.
fn signal(t: f64) -> f64 {
    let phase = std::f64::consts::TAU * t / 50.0;
    1.9 + 1.4 * phase.sin() + 0.35 * (3.0 * phase).sin()
}

/// The centre frequencies of the octave bands, in hertz, and the levels of the pump and of the background in each,
/// in decibels.
const BANDS: [(f64, f64, f64); 9] = [
    (31.5, 62.0, 48.0),
    (63.0, 71.0, 46.0),
    (125.0, 78.0, 41.0),
    (250.0, 74.0, 37.0),
    (500.0, 69.0, 33.0),
    (1000.0, 72.0, 30.0),
    (2000.0, 64.0, 27.0),
    (4000.0, 55.0, 24.0),
    (8000.0, 46.0, 22.0),
];

pub fn figure() -> Figure {
    let t = linspace(0.0, SAMPLE_MS * (SAMPLES - 1) as f64, 301);
    let analogue: Vec<f64> = t.iter().map(|&t| signal(t)).collect();
    let sample_t: Vec<f64> = (0..SAMPLES).map(|k| k as f64 * SAMPLE_MS).collect();
    let held: Vec<f64> = sample_t
        .iter()
        .map(|&t| ((signal(t) / LEVEL_V).round() * LEVEL_V).clamp(0.0, 15.0 * LEVEL_V))
        .collect();
    // The edges of an octave band lie a half octave either side of its centre.
    let mut edges: Vec<f64> = BANDS.iter().map(|b| b.0 / 2f64.sqrt()).collect();
    edges.push(BANDS[BANDS.len() - 1].0 * 2f64.sqrt());
    let band_centres: Vec<f64> = BANDS.iter().map(|b| b.0).collect();

    let mut fig = Figure::new()
        .size_mm(180.0, 75.0)
        .tiles(1, 2)
        .title("Held samples and binned levels")
        .tag("stairs")
        .tag("line")
        .tag("subplots")
        .tag("legend")
        .tag("log")
        .tag("signals")
        .tag("measurements")
        .tag("step")
        .tag("sample-and-hold")
        .tag("spectrum")
        .parameter("dimensionality", "2D")
        .parameter("artists", 4)
        .parameter("data_points", 692)
        .parameter("has_legend", true);

    let mut ax = fig.axes(0, 0);
    ax.plot(&t, &analogue).label("Analogue signal");
    ax.stairs_at(&sample_t, &held, StepAt::Post)
        .label("Held output")
        .line_width(1.25);
    ax.xlim(0.0, sample_t[SAMPLES - 1])
        .ylim(0.0, 4.0)
        .xlabel("Time (ms)")
        .ylabel("Voltage (V)")
        .title("Sample and hold")
        .legend(LegendLocation::NorthEast);

    let mut ax = fig.axes(0, 1);
    ax.stairs(&edges, BANDS.map(|b| b.1))
        .label("Pump")
        .base(0.0)
        .fill(Color::rgb(0.55, 0.70, 0.88))
        .color(Color::rgb(0.10, 0.30, 0.60))
        .line_width(1.0);
    ax.stairs(&edges, BANDS.map(|b| b.2))
        .label("Background")
        .base(0.0)
        .color(Color::rgb(0.80, 0.30, 0.10))
        .line_width(1.0);
    ax.xscale(Scale::Log)
        .xlim(edges[0], edges[edges.len() - 1])
        .ylim(0.0, 100.0)
        .xticks(&band_centres)
        .xtick_labels(BANDS.map(|b| {
            if b.0 < 1000.0 {
                format!("{}", b.0)
            } else {
                format!("{}k", b.0 / 1000.0)
            }
        }))
        .xlabel("Octave band centre frequency (Hz)")
        .ylabel("Sound pressure level (dB)")
        .title("Octave-band spectrum")
        .legend(LegendLocation::NorthEast);
    fig
}