Categorical strip chart
Where boundary-layer transition falls within its station interval, on the upper and lower surface of twelve synthetic aerofoil test cases, one row per case. There is no categorical axis type: each row is an explicit y tick at its index, named by an explicit tick label, and the y axis is reversed so that the first case is at the top. Only the left panel names the rows; the right panel hides its tick labels, and the two plot areas are the same width because the layout shares the page between plot areas after the margins are taken out. The inviscid cases have no transition, so their rows are empty but kept. Dotted lines mark the ends and the middle of the interval, and the legend panel explains the marker styles once.
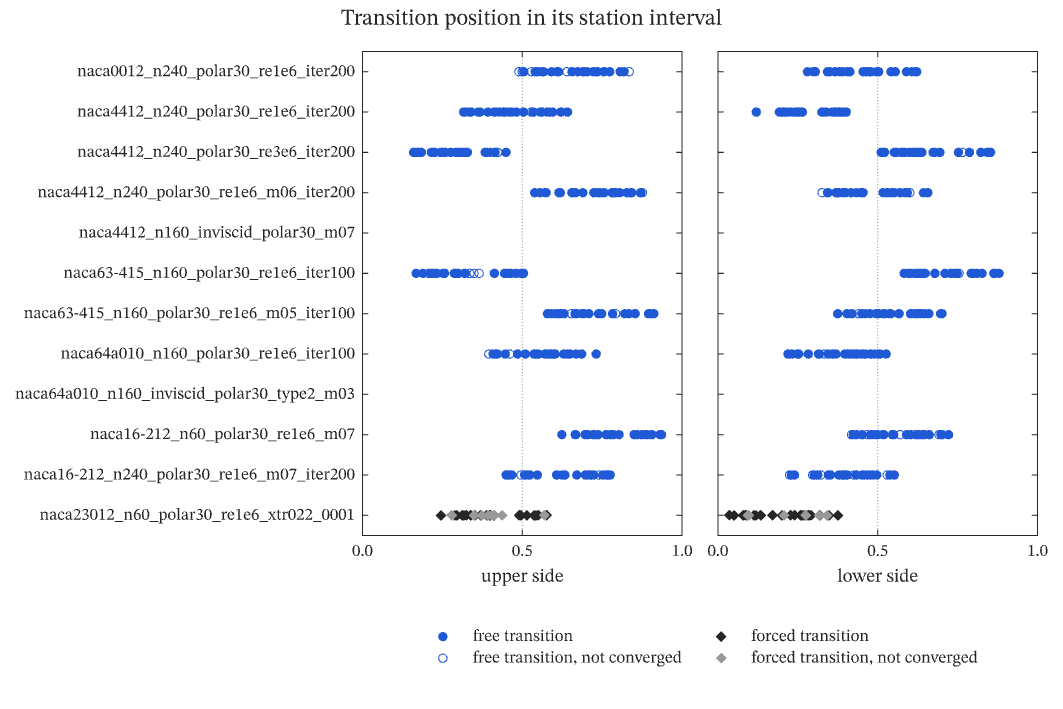
The figure above is live, drawn in the browser by the same engine that draws the viewer: drag it to pan, and click it to zoom with the wheel. Download the PDF for the vector figure that IronLAB exports, or read how to embed a figure of your own.
Source
The figure is built by the following code.
use ironlab::prelude::*;

pub const TITLE: &str = "Categorical strip chart";
pub const DESCRIPTION: &str = "Where boundary-layer transition falls within its station interval, on the upper and \
     lower surface of twelve synthetic aerofoil test cases, one row per case. There is no categorical axis type: \
     each row is an explicit y tick at its index, named by an explicit tick label, and the y axis is reversed so \
     that the first case is at the top. Only the left panel names the rows; the right panel hides its tick labels, \
     and the two plot areas are the same width because the layout shares the page between plot areas after the \
     margins are taken out. The inviscid cases have no transition, so their rows are empty but kept. Dotted lines \
     mark the ends and the middle of the interval, and the legend panel explains the marker styles once.";

/// The test cases, in the order in which they are listed, top to bottom. The inviscid cases have no boundary
/// layer, so they have no transition to plot.
const CASES: [&str; 12] = [
    "naca0012_n240_polar30_re1e6_iter200",
    "naca4412_n240_polar30_re1e6_iter200",
    "naca4412_n240_polar30_re3e6_iter200",
    "naca4412_n240_polar30_re1e6_m06_iter200",
    "naca4412_n160_inviscid_polar30_m07",
    "naca63-415_n160_polar30_re1e6_iter100",
    "naca63-415_n160_polar30_re1e6_m05_iter100",
    "naca64a010_n160_polar30_re1e6_iter100",
    "naca64a010_n160_inviscid_polar30_type2_m03",
    "naca16-212_n60_polar30_re1e6_m07",
    "naca16-212_n240_polar30_re1e6_m07_iter200",
    "naca23012_n60_polar30_re1e6_xtr022_0001",
];

/// How the transition of one polar point was found, which sets its marker.
#[derive(Clone, Copy, PartialEq)]
enum Kind {
    /// Free transition at a converged point.
    Free,
    /// Free transition at a point that did not converge.
    Unconverged,
    /// Transition forced by a trip, upstream of where it would occur freely.
    Forced,
    /// Transition forced by a trip at a point that did not converge.
    ForcedUnconverged,
}

const KINDS: [Kind; 4] = [
    Kind::Free,
    Kind::Unconverged,
    Kind::Forced,
    Kind::ForcedUnconverged,
];

const BLUE: Color = Color::rgb(0.12, 0.35, 0.84);
const DARK: Color = Color::rgb(0.15, 0.15, 0.15);
const GREY: Color = Color::rgb(0.6, 0.6, 0.6);
const REFERENCE: Color = Color::rgb(0.55, 0.55, 0.55);

impl Kind {
    fn name(self) -> &'static str {
        match self {
            Kind::Free => "free transition",
            Kind::Unconverged => "free transition, not converged",
            Kind::Forced => "forced transition",
            Kind::ForcedUnconverged => "forced transition, not converged",
        }
    }
}

/// A small deterministic generator, so that the synthetic positions are the same on every run.
struct Lcg(u64);

impl Lcg {
    /// Returns a number drawn from `[0, 1)`.
    fn unit(&mut self) -> f64 {
        self.0 = self
            .0
            .wrapping_mul(6_364_136_223_846_793_005)
            .wrapping_add(1_442_695_040_888_963_407);
        (self.0 >> 11) as f64 / (1u64 << 53) as f64
    }
}

/// Returns the positions of transition within the station interval, each with its kind, for every point of the
/// polar of case `case` on one side of the section.
fn positions(case: usize, upper: bool) -> Vec<(f64, Kind)> {
    if CASES[case].contains("inviscid") {
        return Vec::new();
    }
    let mut rng = Lcg(1 + 2 * case as u64 + u64::from(upper));
    let forced = CASES[case].contains("xtr");
    // Each case spreads its points about a centre of its own, with a few unconverged outliers.
    let centre = 0.2 + 0.6 * rng.unit();
    (0..30)
        .map(|_| {
            let position = (centre + 0.35 * (rng.unit() - 0.5)).clamp(0.0, 1.0);
            let converged = rng.unit() > 0.15;
            let kind = match (forced, converged) {
                (false, true) => Kind::Free,
                (false, false) => Kind::Unconverged,
                (true, true) => Kind::Forced,
                (true, false) => Kind::ForcedUnconverged,
            };
            (position, kind)
        })
        .collect()
}

pub fn figure() -> Figure {
    let rows: Vec<f64> = (0..CASES.len()).map(|k| k as f64).collect();
    let (top, bottom) = (-0.5, CASES.len() as f64 - 0.5);

    let mut fig = Figure::new()
        .size_mm(180.0, 120.0)
        .tiles(2, 2)
        .row_weights([9.0, 2.0])
        .title("Transition position in its station interval")
        .tag("line")
        .tag("scatter")
        .tag("subplots")
        .tag("legend")
        .tag("markers")
        .tag("ticks")
        .tag("reversed-axes")
        .tag("reference-lines")
        .parameter("dimensionality", "2D")
        .parameter("artists", 46)
        .parameter("data_points", 1224)
        .parameter("has_legend", true);
    let key = fig.panel_span(1, 0, 1, 2).legend().boxed(false).id();

    for (col, upper) in [(0, true), (1, false)] {
        let mut ax = fig.axes(0, col);
        // Dotted references at the ends and the middle of the interval, spanning the plot area from top to bottom
        // however the rows are panned or zoomed.
        for x in [0.0, 0.5, 1.0] {
            ax.vline(x)
                .color(REFERENCE)
                .dash(Dash::Dotted)
                .line_width(0.5);
        }
        for (case, &row) in rows.iter().enumerate() {
            let points = positions(case, upper);
            for kind in KINDS {
                let x: Vec<f64> = points
                    .iter()
                    .filter(|(_, k)| *k == kind)
                    .map(|(x, _)| *x)
                    .collect();
                if x.is_empty() {
                    continue;
                }
                let y = vec![row; x.len()];
                let mut scatter = ax.scatter(&x, &y);
                // Every case's points of one kind share the name and the look, so the key lists each kind once.
                scatter.label(kind.name()).marker_size(4.0);
                match kind {
                    Kind::Free => scatter.marker(Marker::Circle).color(BLUE).filled(),
                    Kind::Unconverged => scatter.marker(Marker::Circle).color(BLUE),
                    Kind::Forced => scatter.marker(Marker::Diamond).color(DARK).filled(),
                    Kind::ForcedUnconverged => scatter.marker(Marker::Diamond).color(GREY).filled(),
                };
            }
        }
        ax.xlim(0.0, 1.0)
            .xtick_step(0.5)
            .xlabel(if upper { "upper side" } else { "lower side" })
            .ylim(top, bottom)
            .yreverse(true)
            .yticks(&rows)
            .legend_in(key);
        if upper {
            ax.ytick_labels(CASES.map(Text::plain));
        } else {
            ax.ytick_labels_hidden();
        }
    }
    fig
}