Shared x limits
A signal, its derivative and its running integral stacked in three rows whose x limits are all linked with a single call. Zooming into a time interval in any row zooms every row.
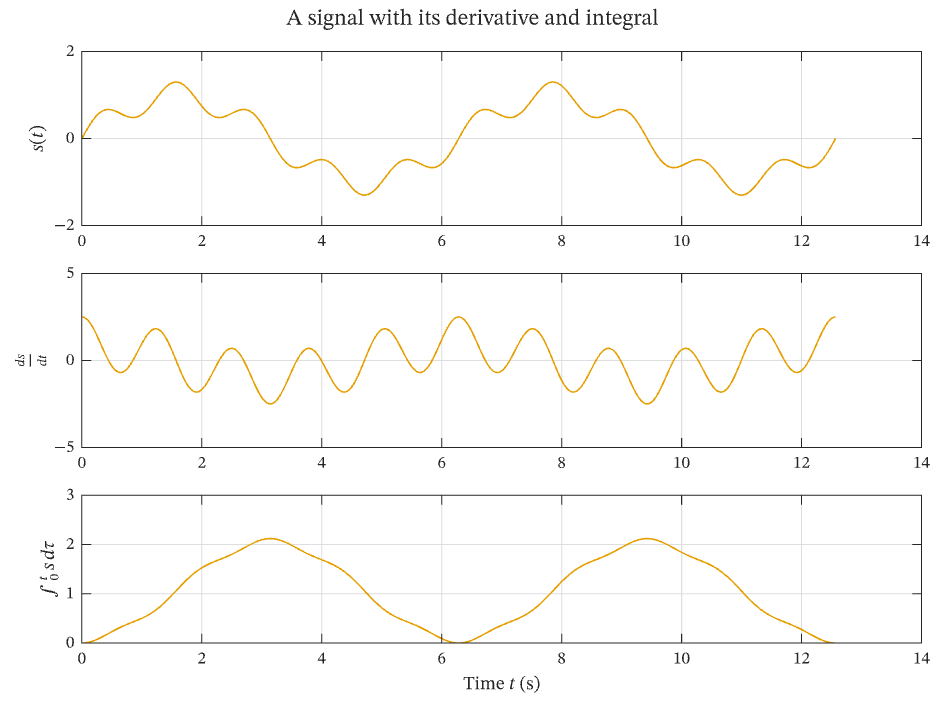
Select the image, or download the PDF, to open the vector figure exported by IronLAB.
Source
The figure is built by the following code.
use std::f64::consts::PI;

use ironlab::prelude::*;

pub const TITLE: &str = "Shared x limits";
pub const DESCRIPTION: &str = "A signal, its derivative and its running integral stacked in three rows whose x limits \
     are all linked with a single call. Zooming into a time interval in any row zooms every row.";

pub fn figure() -> Figure {
    // The signal s(t) = sin t + 0.3 sin 5t, with its derivative and integral from 0 to t worked out by hand.
    let t = linspace(0.0, 4.0 * PI, 401);
    let signal: Vec<f64> = t.iter().map(|t| t.sin() + 0.3 * (5.0 * t).sin()).collect();
    let derivative: Vec<f64> = t.iter().map(|t| t.cos() + 1.5 * (5.0 * t).cos()).collect();
    let integral: Vec<f64> = t
        .iter()
        .map(|t| (1.0 - t.cos()) + 0.06 * (1.0 - (5.0 * t).cos()))
        .collect();

    let mut fig = Figure::new()
        .size_mm(160.0, 120.0)
        .tiles(3, 1)
        .title("A signal with its derivative and integral");
    let rows = [
        (0, &signal, r"$s(t)$"),
        (1, &derivative, r"$\frac{ds}{dt}$"),
        (2, &integral, r"$\int_0^t s\,d\tau$"),
    ];
    for (row, values, label) in rows {
        let mut ax = fig.axes(row, 0);
        ax.plot(&t, values);
        ax.ylabel(label).grid(true);
    }
    fig.axes(2, 0).xlabel("Time $t$ (s)");
    fig.link_all_x().expect("every row shares the same time axis");
    fig
}