Shared y limits
Temperature profiles against depth at three sites, side by side in axes whose y limits are all linked with a single call, so that equal depths stay level when any panel is panned or zoomed.
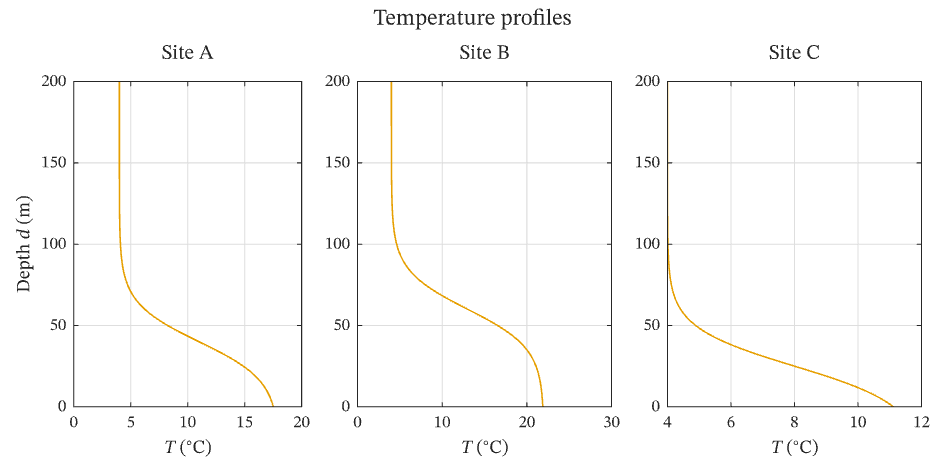
Select the image, or download the PDF, to open the vector figure exported by IronLAB.
Source
The figure is built by the following code.
use ironlab::prelude::*;

pub const TITLE: &str = "Shared y limits";
pub const DESCRIPTION: &str = "Temperature profiles against depth at three sites, side by side in axes whose y limits \
     are all linked with a single call, so that equal depths stay level when any panel is panned or zoomed.";

/// Returns the water temperature in °C at a depth in metres: a smooth thermocline, about 12 m thick, between warm
/// surface water and 4 °C deep water.
fn temperature_c(depth_m: f64, surface_temperature_c: f64, thermocline_depth_m: f64) -> f64 {
    let deep_temperature_c = 4.0;
    let thickness_m = 12.0;
    deep_temperature_c
        + (surface_temperature_c - deep_temperature_c)
            / (1.0 + ((depth_m - thermocline_depth_m) / thickness_m).exp())
}

pub fn figure() -> Figure {
    let depth_m = linspace(0.0, 200.0, 81);
    // Each site is (tile column, name, surface temperature in °C, thermocline depth in m).
    let sites = [
        (0, "Site A", 18.0, 40.0),
        (1, "Site B", 22.0, 60.0),
        (2, "Site C", 12.0, 25.0),
    ];

    let mut fig = Figure::new()
        .size_mm(160.0, 80.0)
        .tiles(1, 3)
        .title("Temperature profiles");
    for (col, name, surface_temperature_c, thermocline_depth_m) in sites {
        let temperature: Vec<f64> = depth_m
            .iter()
            .map(|&d| temperature_c(d, surface_temperature_c, thermocline_depth_m))
            .collect();
        let mut ax = fig.axes(0, col);
        ax.plot(&temperature, &depth_m);
        ax.title(name)
            .xlabel(r"$T$ ($^\circ$C)")
            .ylim(0.0, 200.0)
            .grid(true);
        if col == 0 {
            ax.ylabel("Depth $d$ (m)");
        }
    }
    fig.link_all_y().expect("every site shares the same depth axis");
    fig
}