Linked subplots
Six axes with three groups of linked limits: the top row shares its y limits, the left column shares its x limits, and a diagonal pair shares its x limits. In the viewer, panning or zooming an axes moves every axes linked with it along that dimension.
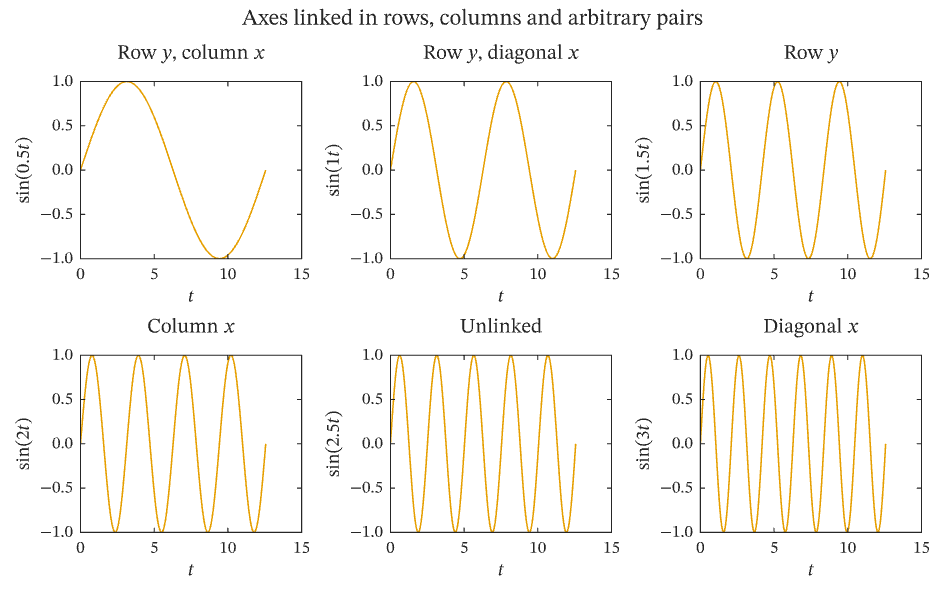
Select the image, or download the PDF, to open the vector figure exported by IronLAB.
Source
The figure is built by the following code.
use std::f64::consts::PI;

use ironlab::prelude::*;

pub const TITLE: &str = "Linked subplots";
pub const DESCRIPTION: &str = "Six axes with three groups of linked limits: the top row shares its y limits, the left \
     column shares its x limits, and a diagonal pair shares its x limits. In the viewer, panning or zooming an axes \
     moves every axes linked with it along that dimension.";

pub fn figure() -> Figure {
    let mut fig = Figure::new()
        .size_mm(160.0, 100.0)
        .tiles(2, 3)
        .title("Axes linked in rows, columns and arbitrary pairs");

    // Each tile plots a sine wave of a different frequency: 0.5, 1, 1.5, ... from left to right and top to bottom.
    let t = linspace(0.0, 4.0 * PI, 201);
    for row in 0..2 {
        for col in 0..3 {
            let tile_number = row * 3 + col + 1;
            let frequency = f64::from(tile_number) / 2.0;
            let signal: Vec<f64> = t.iter().map(|t| (frequency * t).sin()).collect();
            let mut ax = fig.axes(row, col);
            ax.plot(&t, &signal);
            ax.xlabel("$t$").ylabel(format!(r"$\sin({frequency}t)$"));
        }
    }

    fig.axes(0, 0).title("Row $y$, column $x$");
    fig.axes(0, 1).title("Row $y$, diagonal $x$");
    fig.axes(0, 2).title("Row $y$");
    fig.axes(1, 0).title("Column $x$");
    fig.axes(1, 1).title("Unlinked");
    fig.axes(1, 2).title("Diagonal $x$");

    // Links are made between axes identifiers, which fig.axes(row, col).id() returns for each tile.
    let top_row = [fig.axes(0, 0).id(), fig.axes(0, 1).id(), fig.axes(0, 2).id()];
    let left_column = [fig.axes(0, 0).id(), fig.axes(1, 0).id()];
    let diagonal_pair = [fig.axes(0, 1).id(), fig.axes(1, 2).id()];
    fig.link(Dim::Y, &top_row)
        .expect("the top row belongs to this figure");
    fig.link(Dim::X, &left_column)
        .expect("the left column belongs to this figure");
    fig.link(Dim::X, &diagonal_pair)
        .expect("the diagonal pair belongs to this figure");
    fig
}