Unlinked subplots
Four independent axes in a two-by-two grid of tiles. Panning or zooming one of them in the viewer leaves the others unchanged.
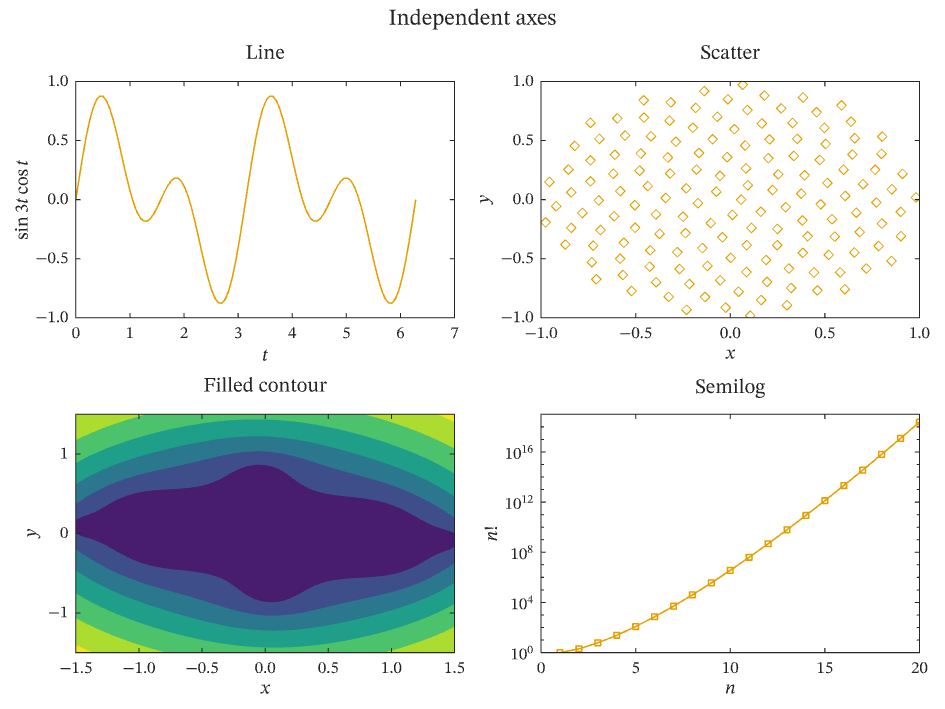
Select the image, or download the PDF, to open the vector figure exported by IronLAB.
Source
The figure is built by the following code. Its data comes from the functions on the data helpers page.
use std::f64::consts::PI;

use ironlab::prelude::*;

use crate::fields::*;

pub const TITLE: &str = "Unlinked subplots";
pub const DESCRIPTION: &str = "Four independent axes in a two-by-two grid of tiles. Panning or zooming one of them in \
     the viewer leaves the others unchanged.";

pub fn figure() -> Figure {
    let mut fig = Figure::new()
        .size_mm(160.0, 120.0)
        .tiles(2, 2)
        .title("Independent axes");

    let t = linspace(0.0, 2.0 * PI, 101);
    let wave: Vec<f64> = t.iter().map(|t| (3.0 * t).sin() * t.cos()).collect();
    let mut ax = fig.axes(0, 0);
    ax.plot(&t, &wave);
    ax.title("Line").xlabel("$t$").ylabel(r"$\sin 3t \cos t$");

    let (x, y) = sunflower(150, 1.0);
    let mut ax = fig.axes(0, 1);
    ax.scatter(&x, &y).marker(Marker::Diamond);
    ax.title("Scatter").xlabel("$x$").ylabel("$y$");

    let (grid_x, grid_y, field) = julia_grid(81);
    let mut ax = fig.axes(1, 0);
    ax.contourf(&grid_x, &grid_y, &field).levels(8);
    ax.title("Filled contour").xlabel("$x$").ylabel("$y$");

    // n! grows faster than any exponential, so it curves upwards even on a logarithmic axis.
    let n: Vec<f64> = (1..=20).map(f64::from).collect();
    let factorial: Vec<f64> = (1..=20)
        .map(|n| (1..=n).map(f64::from).product())
        .collect();
    let mut ax = fig.axes(1, 1);
    ax.semilogy(&n, &factorial)
        .marker(Marker::Square)
        .marker_size(3.0);
    ax.title("Semilog").xlabel("$n$").ylabel("$n!$");

    fig
}