Two keys
The displacement thickness of the boundary layer on a symmetric aerofoil section at two angles of attack, drawn as offsets from the surface, with markers at the points of transition and separation on each surface. The curve key on the left lists the curves. The marker key on the right explains the markers once, with items that stand for no plot: a grey shape for each kind of point, and a colour swatch for each surface, however many markers are drawn. Both keys sit in a row fitted to the taller of them.
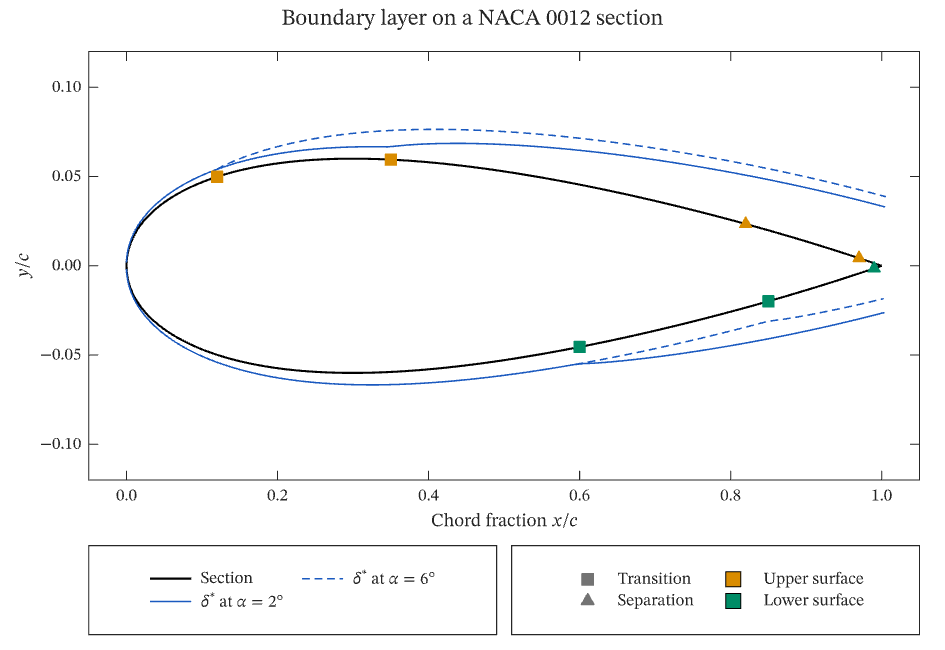
The figure above is live, drawn in the browser by the same engine that draws the viewer: drag it to pan, and click it to zoom with the wheel. Download the PDF for the vector figure that IronLAB exports, or read how to embed a figure of your own.
Source
The figure is built by the following code.
use ironlab::prelude::*;

pub const TITLE: &str = "Two keys";
pub const DESCRIPTION: &str = "The displacement thickness of the boundary layer on a symmetric aerofoil section at \
     two angles of attack, drawn as offsets from the surface, with markers at the points of transition and \
     separation on each surface. The curve key on the left lists the curves. The marker key on the right explains the \
     markers once, with items that stand for no plot: a grey shape for each kind of point, and a colour swatch for \
     each surface, however many markers are drawn. Both keys sit in a row fitted to the taller of them.";

const UPPER: Color = Color::rgb(0.85, 0.55, 0.0);
const LOWER: Color = Color::rgb(0.0, 0.55, 0.40);
const GREY: Color = Color::rgb(0.45, 0.45, 0.45);
const SECTION: Color = Color::rgb(0.0, 0.0, 0.0);
const THICKNESS: Color = Color::rgb(0.10, 0.35, 0.75);
/// The size of the markers of the points of transition and separation, in points.
const POINT_SIZE: f64 = 6.0;

/// Returns the sample of a kind of point in the marker key: a grey marker of the given shape, the size of the
/// markers drawn on the section, without a line.
fn point_kind(shape: Marker) -> LegendSample {
    match LegendSample::marker(shape, GREY) {
        LegendSample::Line { line, marker } => LegendSample::Line {
            line,
            marker: ironlab::MarkerStyle {
                size_pt: POINT_SIZE,
                ..marker
            },
        },
        swatch => swatch,
    }
}

/// Returns the half-thickness of a NACA 0012 section at chord fraction `x`.
fn half_thickness(x: f64) -> f64 {
    0.6 * (0.2969 * x.sqrt() - 0.1260 * x - 0.3516 * x.powi(2) + 0.2843 * x.powi(3)
        - 0.1036 * x.powi(4))
}

/// Returns the displacement thickness, exaggerated to be visible, at chord fraction `x` of a surface whose
/// boundary layer becomes turbulent at `transition`.
fn displacement(x: f64, transition: f64) -> f64 {
    let laminar = 0.012 * x.sqrt();
    let turbulent = 0.03 * (x - transition).max(0.0).powf(0.8);
    laminar + turbulent
}

/// Returns the points of a surface (`side` is 1 for the upper surface and −1 for the lower) offset along its normal
/// by the displacement thickness.
fn offset(x: &[f64], side: f64, transition: f64) -> (Vec<f64>, Vec<f64>) {
    let h = 1e-4;
    x.iter()
        .map(|&x| {
            let x = x.clamp(h, 1.0 - h);
            let y = side * half_thickness(x);
            let slope = side * (half_thickness(x + h) - half_thickness(x - h)) / (2.0 * h);
            let norm = (1.0 + slope * slope).sqrt();
            let d = displacement(x, transition);
            (x - side * slope / norm * d, y + side / norm * d)
        })
        .unzip()
}

pub fn figure() -> Figure {
    let x: Vec<f64> = linspace(0.0, 1.0, 121)
        .into_iter()
        .map(|s| 0.5 * (1.0 - (std::f64::consts::PI * s).cos()))
        .collect();

    let mut fig = Figure::new()
        .size_mm(160.0, 110.0)
        .tiles(2, 2)
        .fit_row(1)
        .title("Boundary layer on a NACA 0012 section")
        .tag("line")
        .tag("scatter")
        .tag("legend")
        .tag("markers")
        .tag("simulations")
        .parameter("dimensionality", "2D")
        .parameter("artists", 14)
        .parameter("data_points", 1468)
        .parameter("has_legend", true);
    let curves = fig.panel(1, 0).id();
    let mut ax = fig.axes_span(0, 0, 1, 2);

    // The section itself, upper and lower surface.
    let upper: Vec<f64> = x.iter().map(|&x| half_thickness(x)).collect();
    let lower: Vec<f64> = upper.iter().map(|y| -y).collect();
    ax.plot(&x, &upper)
        .label("Section")
        .color(SECTION)
        .line_width(1.0);
    ax.plot(&x, &lower).color(SECTION).line_width(1.0);

    // One curve per design point: the same hue for the same quantity, a dash for each angle of attack. The points of
    // transition and separation are marked by shape and coloured by surface, and none of them has a display name, so
    // that the curve key lists the curves alone.
    for (alpha, dash, transitions, separations) in [
        (2.0, Dash::Solid, (0.35, 0.60), (0.97, 0.99)),
        (6.0, Dash::Dashed, (0.12, 0.85), (0.82, 0.99)),
    ] {
        let name = format!(r"$\delta^*$ at $\alpha = {alpha}°$");
        for (side, transition, separation, colour) in [
            (1.0, transitions.0, separations.0, UPPER),
            (-1.0, transitions.1, separations.1, LOWER),
        ] {
            let (ox, oy) = offset(&x, side, transition);
            let mut curve = ax.plot(&ox, &oy);
            curve.color(THICKNESS).dash(dash);
            if side > 0.0 {
                curve.label(name.as_str());
            }
            for (at, shape) in [(transition, Marker::Square), (separation, Marker::TriangleUp)] {
                let y = side * half_thickness(at);
                ax.scatter([at], [y])
                    .marker(shape)
                    .color(colour)
                    .marker_size(POINT_SIZE)
                    .filled();
            }
        }
    }
    ax.xlim(-0.05, 1.05)
        .ylim(-0.12, 0.12)
        .xlabel("Chord fraction $x/c$")
        .ylabel("$y/c$")
        .legend_in(curves);

    // The marker key: items that stand for no plot, explaining shape and colour once each.
    fig.panel(1, 1).legend()
        .custom_item(point_kind(Marker::Square), "Transition")
        .custom_item(point_kind(Marker::TriangleUp), "Separation")
        .custom_item(LegendSample::swatch(UPPER), "Upper surface")
        .custom_item(LegendSample::swatch(LOWER), "Lower surface")
        .columns(LegendEntryColumns::Count(2));
    fig
}