Wind rose
A synthetic but plausible year of hourly wind at a coastal site, drawn from a seeded mixture of a prevailing south-westerly, a weaker north-westerly and light winds from any direction, with speeds from Weibull distributions. The axes are polar, with north up and bearings clockwise, as on a compass. The directions are binned into sixteen sectors centred on the compass points, so that the sector of north spans north itself, and the speeds into five classes, each stacked on the classes below it. The length of each band is the percentage of all the hours in which the wind blew from that sector at that speed; hours of calm, below 0.5 m/s, count towards the total but are drawn in no class, so the petals sum to a little under 100 %.
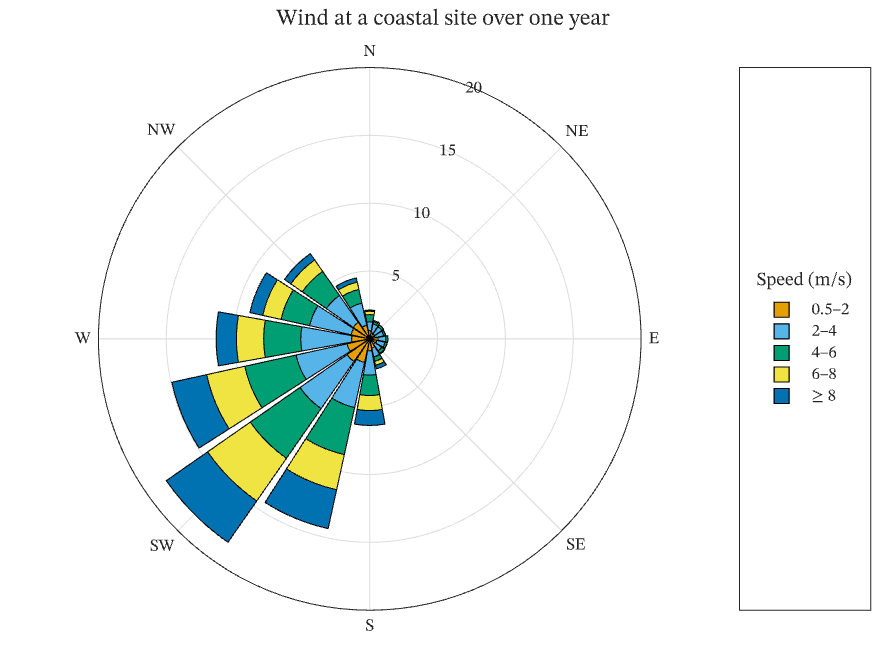
The figure above is live, drawn in the browser by the same engine that draws the viewer: drag it to pan, and click it to zoom with the wheel. Download the PDF for the vector figure that IronLAB exports, or read how to embed a figure of your own.
Source
The figure is built by the following code.
use ironlab::prelude::*;
pub const TITLE: &str = "Wind rose";
pub const DESCRIPTION: &str = "A synthetic but plausible year of hourly wind at a coastal site, drawn from a seeded \
mixture of a prevailing south-westerly, a weaker north-westerly and light winds from any direction, with speeds \
from Weibull distributions. The axes are polar, with north up and bearings clockwise, as on a compass. The \
directions are binned into sixteen sectors centred on the compass points, so that the sector of north spans \
north itself, and the speeds into five classes, each stacked on the classes below it. The length of each band \
is the percentage of all the hours in which the wind blew from that sector at that speed; hours of calm, below \
0.5 m/s, count towards the total but are drawn in no class, so the petals sum to a little under 100 %.";
/// The number of hourly observations in the year.
const HOURS: usize = 8760;
/// The edges of the speed classes, in metres per second; the last class is open above its edge, and speeds below
/// the first edge are calms.
const SPEED_EDGES: [f64; 5] = [0.5, 2.0, 4.0, 6.0, 8.0];
/// A wind regime of the site.
struct Regime {
/// The share of the hours the regime holds.
share: f64,
/// The mean bearing and the standard deviation of the bearings, in degrees, or none for winds from any direction.
bearing: Option<(f64, f64)>,
/// The scale of the Weibull distribution of speeds, in metres per second.
scale: f64,
}
/// The wind regimes: a prevailing south-westerly, a weaker north-westerly and light winds from any direction.
const REGIMES: [Regime; 3] = [
Regime {
share: 0.55,
bearing: Some((225.0, 28.0)),
scale: 6.5,
},
Regime {
share: 0.25,
bearing: Some((300.0, 30.0)),
scale: 5.0,
},
Regime {
share: 0.20,
bearing: None,
scale: 2.8,
},
];
/// The shape of the Weibull distributions of speed, the value typical of a coastal site.
const WEIBULL_SHAPE: f64 = 2.0;
/// A small deterministic generator, so that the observations are the same on every run.
struct SplitMix64(u64);
impl SplitMix64 {
/// Returns a number drawn uniformly from `(0, 1)`.
fn unit(&mut self) -> f64 {
self.0 = self.0.wrapping_add(0x9e37_79b9_7f4a_7c15);
let mut z = self.0;
z = (z ^ (z >> 30)).wrapping_mul(0xbf58_476d_1ce4_e5b9);
z = (z ^ (z >> 27)).wrapping_mul(0x94d0_49bb_1331_11eb);
z ^= z >> 31;
((z >> 11) as f64 + 0.5) / (1u64 << 53) as f64
}
/// Returns a number drawn from the standard normal distribution, by the Box–Muller transform.
fn normal(&mut self) -> f64 {
let (u, v) = (self.unit(), self.unit());
(-2.0 * u.ln()).sqrt() * (std::f64::consts::TAU * v).cos()
}
}
/// Returns the bearing the wind blows from, in degrees, and its speed, in metres per second, for every hour of the
/// year.
fn observations() -> (Vec<f64>, Vec<f64>) {
let mut rng = SplitMix64(2026);
(0..HOURS)
.map(|_| {
let pick = rng.unit();
let mut share = 0.0;
let regime = REGIMES
.iter()
.find(|regime| {
share += regime.share;
pick < share
})
.unwrap_or(®IMES[REGIMES.len() - 1]);
let direction = match regime.bearing {
Some((mean, sigma)) => (mean + sigma * rng.normal()).rem_euclid(360.0),
None => 360.0 * rng.unit(),
};
let speed = regime.scale * (-rng.unit().ln()).powf(1.0 / WEIBULL_SHAPE);
(direction, speed)
})
.unzip()
}
pub fn figure() -> Figure {
let (directions, speeds) = observations();
let mut fig = Figure::new()
.size_mm(150.0, 110.0)
.tiles(1, 2)
.col_weights([TrackSize::Weight(1.0), TrackSize::Fit])
.title("Wind at a coastal site over one year")
.tag("polar")
.tag("wind-rose")
.tag("bar")
.tag("legend")
.parameter("dimensionality", "2D")
.parameter("artists", 5)
.parameter("data_points", 176)
.parameter("has_legend", true);
let key = fig.panel(0, 1).title("Speed (m/s)").id();
let mut ax = fig.polar_axes(0, 0);
ax.wind_rose(&directions, &speeds, SPEED_EDGES);
ax.xticks([0.0, 45.0, 90.0, 135.0, 180.0, 225.0, 270.0, 315.0])
.xtick_labels(["N", "NE", "E", "SE", "S", "SW", "W", "NW"])
.ytick_step(5.0)
.legend_in(key);
fig
}